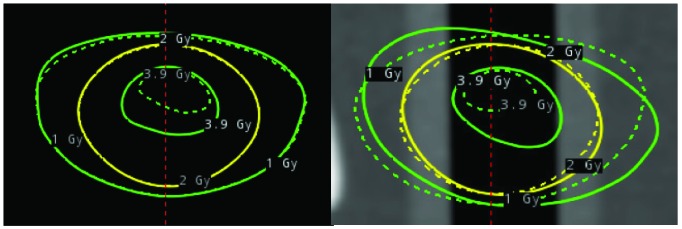
Figure 9.
Overlay of the planned isodose lines (dotted lines) for 1.0 Gy (green), 2.0 Gy (yellow), and 3.9 Gy (green) and the adapted doses for delivery (solid lines) according to daily cone beam computed tomography studies for dose evaluation of the fifth shot. The film plane is shown in coronal view (left) and sagittal view (right).

