

Abstract
A novel full-system test (FST) phantom and method have been developed to demonstrate and quality assure the geometric accuracy of image co-registration and overall shot delivery in the context of SRS using Gamma Knife® Icon™. The method uses Vernier scale bars to achieve sub-voxel precision co-registration measurements and pin-located radiochromic films to determine overall shot delivery precision. Validation tests demonstrated that artificially applied registration errors of < 0.15 mm could be accurately detected and quantified. Cross-validation of full-system test results with the manufacturer standard focal precision test demonstrated that both approaches measure similar focal precision errors, to within < 0.1 mm, and that registration and focal precision components of the full-system geometric error can be successfully decoupled using our Vernier FST approach. CBCT co-registration errors were shown to be of comparable magnitude to the focal precision errors, demonstrating that CBCT registration based in-mask treatments can achieve sub-voxel geometric accuracy, rivalling traditional frame-based immobilisation. This full-system geometric test method and phantom design concept is in principle applicable to any SRS technique involving image co-registration.
Keywords: Gamma Knife, Icon, cone beam CT, co-registration, full-system test
Introduction
Geometric accuracy is paramount in stereotactic radiosurgery (SRS) and stereotactic body radiotherapy (SBRT). Traditional SRS methods involving frame-based cranial immobilisation inherently allow full-system geometric testing, via film irradiation. However, precise measurement of geometric accuracy without stereotactic indexing is challenging, particularly where image registration is involved in the treatment pathway. For intracranial SRS specifically, sub-millimetre geometric accuracy is required. There is a need to demonstrate such a requirement can be met using contemporary SRS techniques based upon the use of non-rigid immobilisation and the co-registration of images with a voxel size greater than the geometric accuracy requirement. These concerns may also affect high-precision SBRT techniques (e.g. spinal SABR), where geometric verification is achieved via image matching.
One common modality for intracranial SRS delivery is the Gamma Knife® (GK) Co60 unit. Launched in 2015, the Icon™-model GK (Elekta Instrument AB, Stockholm, Sweden) introduced the use of cone beam CT (CBCT) GK SRS. Via a calibration established at installation, Icon™’s integral CBCT system images a cubic volume of 448×448×448 voxels, in which each 0.5×0.5×0.5mm3 voxel has a well-defined stereotactic coordinate. The GK’s stereotactic coordinate system, which is used to specify the location of radiation isocentres (so-called ‘shots’) during GK SRS, is conventionally imposed onto the treatment planning tomographic images via fiducial markers attached to a titanium frame screwed to the patient’s skull. In addition to defining the stereotactic coordinate system, this titanium frame also provides rigid immobilisation of the patient to ensure precisely reproducible patient set-up.
As an alternative to the use of fiducial markers, Icon™’s stereotactic CBCT system offers the ability to impose the requisite stereotactic coordinate system onto the treatment planning images via co-registration. Using Icon™, the treatment planning images (typically MRI) can be co-registered to a reference CBCT study acquired during planning. Without the need for fiducial markers and a frame to define the stereotactic coordinate system, Icon™ therefore allows for the first time frameless GK SRS to be performed using a thermoplastic masked-based immobilisation. In turn, mask-based immobilisation offers a practical solution for fractionated GK SRS and a greater degree of workflow flexibility.
The paradigm shift towards a fractionated mask-based approach that is offered by Icon™ does, however, represent a loss of confidence in patient set-up reproducibility that is well-established using the conventional frame-based approach. In order to address the inter-fraction set-up variation inherent to a mask-based immobilisation, Icon™ further utilises the integral stereotactic CBCT system. By performing a pre-treatment CBCT immediately prior to delivery of each fraction, and subsequently co-registering each pre-treatment scan against the reference CBCT acquired during planning, Icon™ is able to automatically correct for any inter-fraction variation in set-up. The rigid co-registration translations and rotations are applied to the planned shot coordinates so creating an adapted treatment plan consisting of shots whose locations are shifted with respect to the stereotactic reference frame, in order that they maintain their planned locations with respect to the anatomical reference frame. This automatically adapted treatment plan therefore maintains delivery of dose to the shifted target volume.
The geometric accuracy, and therefore safety, of Icon™’s adaptive treatment delivery workflow is critically dependent on the accuracy of the rigid co-registration of each pre-treatment CBCT against the reference CBCT. This rigid co-registration is performed automatically in GK’s associated treatment planning system, Leksell GammaPlan (LGP) (Elekta Instruments AB, Stockholm, Sweden), via a simulated annealing numerical optimiser aimed at maximising a mutual information similarity metric1. It is the geometric accuracy of Icon™’s adaptive treatment delivery workflow with which the current investigation is concerned. The authors present a novel phantom and tool for performing an end-to-end test of the geometric accuracy of adaptively-delivered radiation shots, and for assessing the accuracy of the LGP-reported CBCT co-registration translations and rotations themselves. The presented tool and phantom aim to provide confidence to the Icon™ user that the new adaptive mask-based workflow enabled by Icon™ can maintain the geometric accuracy well-established with the traditional frame-based technique.
Background
The ideal full system test (FST) phantom for GK-Icon™ would assess the dosimetric and geometric accuracy of shot delivery. In order to achieve this, radiometric film must be placed at a well-defined position and exposed to treatment irradiation. Dosimetric accuracy can be established from careful film calibration according to well-established methods2,3. For frame-based GK SRS, geometric accuracy of radiation delivery depends upon the positional accuracy of the couch motion relative to the radiation focus. The so-called ‘focal precision’ is verified in isolation from other factors via the manufacturer-supplied focal precision tool, which allows placement of a film at a well-defined stereotactic coordinate, whose location is marked via a hole punctured on the film with a pin. By exposing two films in orthogonal planes, 3 dimensional geometric accuracy can be tested. Mask-based treatments are subject to two additional sources of error. Firstly, unlike a rigid frame, a mask does not eliminate intra-fraction motion; to this end Icon™ gates radiation delivery based upon a stereoscopic camera that tracks patient movement during treatment delivery4. Secondly, and the subject of concern for the current work, is the error in the adapted plan’s shot coordinates that propagates from the uncertainty in the co-registration of the pre-treatment CBCT scan to the stereotactic reference CBCT scan.
There is therefore need for a robust testing methodology to demonstrate and ensure that the overall geometric accuracy of Icon™ mask-based treatments is comparable to the traditional stereotactic frame technique. To this end, a full system test tool, which inserts into the commercially-available RANDO® anthropomorphic head phantom (The Phantom Laboratory, New York, USA) has been developed, along with a software analysis tool, which allows the overall geometric accuracy of the delivered radiation shot to be assessed in terms of the CBCT registration error and the focal precision error.
Our FST tool is designed to directly measure the residual registration error following rigid image registration (RIR) of the pre-treatment and stereotactic reference CBCT data, using physical Vernier scales. Originally developed as a navigational aid for precise measurement of angles, these scales have long been employed to measure distances with greater precision than a uniform rule allows, most commonly in physical callipers or micrometers. By allowing two uniform scales of slightly different pitch to move relative to each other, the measurement resolution is determined by the difference in scale pitch, rather than the pitch itself. In our implementation, the two scale bars comprising each Vernier measure are physically fixed relative to each other. The ability of one bar to ‘move’ relative to the other results only from the freedom of the pre-treatment CBCT image to move over the reference image during image registration. By overlaying the registered images such that one side of the Vernier scale originates from the reference image and the other side from the pre-treatment image, registration errors of the order of the Vernier resolution can be measured. In the case of perfect registration, the two images would perfectly align the central bar pair of each Vernier scale, leading to a zero error measurement.
Materials and Methods
Phantom design
The tool is designed to directly replace a single 2.5 cm thick slice (slice 2) of the commercially available RANDO® anthropomorphic head phantom, in order to provide as realistic an image registration scenario as possible for the FST. The phantom insert is made from PMMA and includes two film holders with marker pins, in the axial and coronal planes respectively. The film planes and pin locations can be identified on CBCT for definition of treatment shot positions. The axial film slot can accommodate a 16mm shot, whilst the coronal slot is limited to an 8 mm shot due to the requirement for the tool to replace a 2.5 cm slice of the RANDO® phantom. From these two orthogonal films, measurement of the actual shot centres relative to the pinhole-marked centres allows quantification of geometric errors in all three directions.
In order to assess image registration at the sub-voxel scale, eight Vernier scales (four in the axial plane and four perpendicular to it), with metal bar pairs are set into the phantom at well-defined positions (Figure 1), along with a ball bearing to define the geometric centre of the Vernier array. These scales are used to determine the error in the 6 degree of freedom (DoF) rigid registration performed as part of the planning process to sub-voxel precision. The scale bars in each Vernier block (Figure 2) are spaced at 1.0 and 1.1 mm on each side of the block. Unlike a physical Vernier scale, where the two sides move independently, the two scales are in fixed relative position with the central bar pairs aligned. By viewing an overlaid image of the post-registration pre-treatment CBCT on the reference CBCT, with the pre-treatment image overlay showing the shorter side of the Vernier block (Figure 3), any mis-registration is measurable as an apparent offset in the position of the best-aligned bar pair. As the spacing of each bar pair is offset by 0.1 mm, and it is possible in practice to determine that two neighbouring bar pairs are equally well aligned, the resolution limit of each axial Vernier scale is 0.05 mm. Due to the 0.5*0.5*0.5 mm voxel size of Icon™ CBCT, the scale bars are placed at 45o to the voxel grid, taking advantage of the partial volume effect so that sub voxel shifts are easier to visualise. Due to space constraints in the phantom slice, the vertical scale bars have fewer bar pairs with a spacing of 1.0 and 1.2 mm, resulting in a theoretical resolution limit of 0.1 mm. Reading of such errors requires the two image sets to be appropriately overlaid and oriented. In-house analysis software (Matlab 2015b) allows the reference and post-registration images to be overlaid in a common frame of reference, using the registration derived from LGP. Direct visualisation of each Vernier scale in overlay allows errors to be visualised at each measurement point.
Figure 1.

a) Phantom design showing Vernier scale bar positions (all measurements in mm) and film slot locations. b) Photograph of phantom as manufactured.
Figure 2.

a) Detail of Vernier scale bar design. Metal bars (black) were precisely set into a polymethylmethacrylate substrate block (grey) which was subsequently inserted into a machined slot in the phantom (Fig. 1). b) Photograph of manufactured Vernier scale block.
Figure 3.

Analysis of registration error using Vernier scale. The moving image (blue) is overlaid on the reference image (greyscale) and the Vernier bar pairs are observed to align six pairs from the central pair, indicating a 0.6 mm offset along the scale bar direction at this location, due to misregistration.
Each scale bar provides a measurement of geometric error in a specific axis at a specific location. In principle, six such measurements should be sufficient to define rigid (6 DoF translational and rotational) registration errors with reference to a centre of rotation. However, these measurement points would ideally be distributed equidistant from the measurement point in all three Cartesian axes. As the ‘slice’ design of the phantom cannot accommodate this arrangement, the vertical Vernier bars are lower resolution than the axial bars and cannot be placed at their ideal locations. Therefore, we measure four vertical errors for redundancy and improved sensitivity to small out-of-plane rotations.
Analysis methodology
The eight measured errors and the nominal coordinates of the Vernier scales are used as input to an Ordinary Procrustes analysis5. This analysis aims to find the optimal translation vector and rotation matrix for aligning two sets of points, in this case the nominal and measured coordinates of the aligned Vernier bar pairs.
At each of the four measurement points, the horizontal and vertical Vernier scale readouts combine to provide 3-dimensional errors. These point offsets are used to define the Procrustes coordinates and hence the Procrustes distance between the reference and co-registered imagesets. The optimal transform to fully align the point sets is recovered using the partial ‘Ordinary Procrustes Analysis’5, wherein scaling is not allowed. Translational offsets are first removed by aligning point cloud centroids, reducing the problem to the constrained orthogonal Procrustes problem, addressed by the Kabsch algorithm6. An iterative implementation is used here, after Umeyama7.
In the context of the current work, this Procrustes analysis yields an estimate of the underlying translational and rotational components of the RIR error in the frame of reference of the phantom’s central ball bearing.
The actual positions of the centre of each Vernier scale (the intersection of the central bar pair), relative to the reference ball bearing centre, were determined from a high resolution CT scan and found to be within 0.1 mm of design position in all cases.
The voxel coordinates of the central ball bearing were measured in the reference image set in LGP. These were converted into locations in stereotactic space via the inherent relationship between the CBCT and stereotactic (STX) frames of reference as determined at machine installation (found in the LGP setup files). The nominal Vernier locations were converted to STX coordinates in the same way. From this point, all calculations were performed in physical units (mm, degrees) and stereotactic space, with rotations about the centre point (100,100,100) mm.
The Vernier scale measurements represent the offset of the reference and co-registered imagesets, via 4 measurements in the X-Y plane and 4 in the Z axis. These measured data are used, along with the known locations of the Vernier scale centres in the reference image, to produce coordinates for the Vernier scale centres in the co-registered image, relative to the origin defined at the central ball bearing. These points represent the ‘moving’ set, with the known reference points as the ‘fixed’ set. Each point set is therefore represented as a 4×3 matrix which is the input to the Procrustes analysis described above.
According to the Ordinary Procrustes method, translations were determined as the average value of the offsets in each axis. As the in-plane Vernier scales lie at 45o to the Cartesian axes, these average errors lie in the X+Y and X-Y directions (Figure 1). These errors are transformed by a 45o 2×2 rotation matrix to find translational errors along the X (left-right) and Y (anterior-posterior) Cartesian axes. The Z (superior-inferior) axis error was directly measured by the mean observed offset in the superior-inferior direction.
Once these mean translational errors were established, they were subtracted from the STX coordinates of the Vernier centre locations, removing the translational component and aligning the reference and post-registration images at the STX reference point (100,100,100)mm. Any residual errors cannot be corrected by translation and must originate from rotation in the rigid registration case. Finding the optimal rotation matrix (determinant = 1) corresponds to the constrained orthogonal Procrustes problem. Whilst analytical approaches such as the Kabsch algorithm6 exist, here the rotation matrix elements were optimised iteratively via least-squares minimisation of the residual error7. Due to the orthogonality and symmetry of the rotation matrix, the three independent rotations (about measurement axes X+Y, X-Y and Z) can be optimised simultaneously. This optimisation minimises the residual error of the (post-translation corrected) rotated coordinates of the aligned Vernier bar pair, relative to their nominal STX coordinates. Again, rotations about the X+Y and X-Y axes are converted to Cartesian rotations via a standard 45o 2×2 rotation matrix.
If the eight measured errors can be represented as pure translation and rotation, the RMS residual error should be strictly zero. In practice, small non-zero residuals result from the limited resolution of the measurement, which implies small scaling or shear terms. Whilst these could in principle be represented in a fully affine registration, the phantom is physically rigid and the registration contains no such degrees of freedom, so these (typically very small) additional terms have no physical meaning.
Registration accuracy tool validation
Performance of the test phantom was assessed primarily by introducing known artificial errors into a reference registration. Due to the expected resolution limit of 0.1 mm in plane and 0.2 mm out of plane, translational errors of 0.15 mm and 0.3 mm were applied in-plane and 0.2 and 0.4 mm errors were applied out of plane. Applied rotational errors were 0.15/0.3 and 0.2/0.4 degrees in and out of plane respectively. Known errors were applied both in isolation and in combination. In this way, error recovery in each DoF was rigorously tested, in order to ensure that geometric errors were reproduced accurately.
Following this initial validation, six sets of randomly generated registration errors (error magnitudes 0-0.5 mm and 0-0.5deg) were applied to the reference data and measured using the tool and analysis algorithm. Due to the requirement for human assessment of the Vernier scales, inter-observer variability (4 observers) in the analysis was also assessed. In this way, mean measurement errors and their standard deviations where measured for each DoF.
FST vs. Focal Precision Test
Planning reference and pre-treatment CBCTs were acquired by setting up and scanning the phantom, applying a small perturbation to the setup position and rescanning, prior to shot delivery. Planning was performed on the initial CBCT with shots centred on both marker pins. The post-perturbation CBCT was rigidly registered to the planning CBCT (LGP) and the registration transform (T) extracted from the LGP output file. Subsequently, both CBCT datasets were overlaid using the LGP derived transform and assessed for registration error as described above. As per the standard mask-immobilised Icon™ treatment workflow, the treatment plan was automatically adapted by LGP based upon the registration result, and the treatment delivered. Overall translational errors in the delivered dose were determined from the shot centre positions as measured on the radiochromic film inserts and measured registration errors (including corrections for rotation) were subtracted. The residual errors, which should correspond to couch positioning error, were compared to the couch error as determined from the separate manufacturer specified GK Icon™ Focal Precision test, which was performed immediately following the FST. In each case, shot centre locations were determined from radiochromic film by scanning (300 dpi), thresholding at 80 % of maximum shot intensity and centroiding using the ‘Particle Analysis’ function within the FIJI biological image analysis package8. Pinhole centres were determined by visual inspection of the scanned film image.
Results
Registration accuracy tool validation
All applied errors were recovered in the appropriate axis and with the correct sign. 94% of recovered error magnitudes were within 0.1 mm and 0.1deg of the applied value (max discrepancy 0.17 mm).
Assessment of randomly generated errors showed mean residuals < 0.02mm and < 0.02deg except in the cases of X and Y axis rotations, which showed residual errors of 0.06 and +0.07 deg respectively. Mean residual errors and standard deviations (representing inter-observed variation) are shown in Table 1.
Table 1.
Mean residual registration errors following subtraction of applied errors from measured errors for a range of randomly generated mis-registration scenarios, before and after correction for systematic manufacturing error (see text and Fig. 4)
| Degree of Freedom | Mean residual error (s.d.) | Manufacturing induced systematic error | Mean residual error after correction | |
| X / mm | 0.01 (0.09) | 0.00 | 0.01 | |
| Y / mm | 0.00 (0.08) | 0.00 | 0.00 | |
| Z / mm | 0.01 (0.04) | 0.02 | -0.01 | |
| X Rot / deg | -0.06 (0.02) | -0.07 | 0.01 | |
| Y Rot / deg | 0.07 (0.08) | 0.05 | 0.02 | |
| Z Rot / deg | 0.00 (0.03) | 0.00 | 0.00 |
Both X and Y rotation showed large mean errors, suggesting a systematic offset. On inspection of the inherent bar pair alignment within the phantom, the vertical scale bar at position 4 was found to be marginally misaligned (figure. 4), such that the scale reads +0.2 mm even with perfect registration. A smaller misalignment of 0.1 mm was found in the vertical scale bar at position 1. In combination, these manufacturing inaccuracies yield an apparent registration error in Z translation, X rotation and Y rotation, as shown in Table 1.
Figure 4.
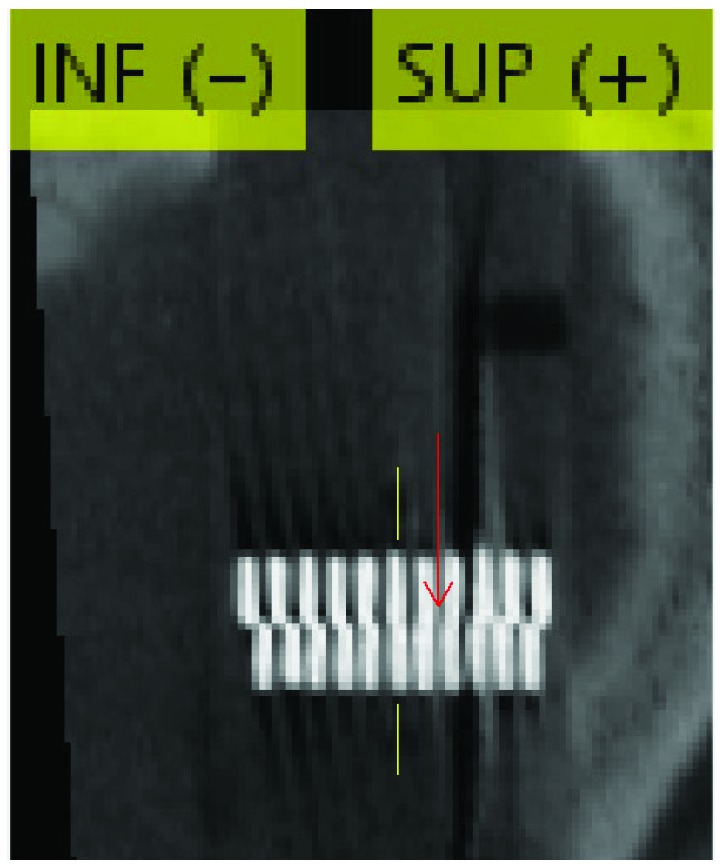
In one vertically aligned Vernier scale, a 0.3 mm offset was apparent on the fixed image only, resulting from slight manufacturing inaccuracy. The scale is aligned at a position between the 7th and 8th bar pairs (red arrow) rather than the 6th (central) bar pair (yellow lines). This resulted in a systematic error in all degrees of freedom, which was identified and removed from the results presented (see text and Figure 5)
Correcting the measured data for these systematic manufacturing errors yields the distribution of residual errors shown in Figure 5, with all mean residual errors <0.1 mm and <0.1 deg. Notably, X translation, Y translation and Y axis rotation show larger standard deviations than the other degrees of freedom.
Figure 5.

Residual error distributions, following subtraction of applied errors from measured errors. Distributions were derived by a 4 observer intercomparison based on 6 randomly-generated synthetic misregistrations. a) Translational and b) rotational residuals prior to correction for systematic manufacturing inaccuracy. c) Translational and d) rotational residuals following systematic correction.
FST vs. Focal Precision Test
Couch positioning errors derived from the two independent FSTs (following registration error correction) were compared to couch position errors from the Focal Precision Test (FPT) performed immediately after the second FST (Table 2). The average FST derived errors were all within 0.1 mm of the manufacturer FPT results. Overall FST errors were extremely small in the X and Y directions, due to cancellation of couch and registration errors. In the Z direction a larger overall error resulted from summation of registration and couch positioning errors. Overall and couch positioning errors derived from the FST phantom and directly measured via FPT were found to be within the 0.3 mm tolerance specified by Elekta in all cases.
Table 2.
Mean Overall, registration and residual translational Full System Test (FST) errors measured in practice, with Focal Precision Test (FPT) errors and difference between geometric errors as determined from the FST and FPT methods.
| Axis | Overall FST Error / mm | Registration FST Error / mm | Geometric FST Error / mm | Geometric FPT Error / mm | Difference Error FST-FPT / mm |
| X | -0.013 | -0.023 | 0.011 | 0.025 | -0.015 |
| Y | 0.013 | -0.106 | 0.119 | 0.051 | 0.068 |
| Z | 0.241 | 0.106 | 0.135 | 0.140 | -0.005 |
| dr | 0.242 | 0.152 | 0.180 | 0.151 | 0.070 |
Discussion
The ability of the phantom described herein to accurately detect sub-voxel rigid registration errors in CBCT is demonstrated by the small mean residual errors and narrow standard deviations recovered from a multi-observer analysis. Once manufacturing imperfections are accounted for, mean residual errors are extremely close to zero, indicating that no systematic factors remain. The precision of registration error detection is limited by the ability of an observer to identify the matching bar pair, where neighbouring pairs appear to have similar match quality. With practice, visual interpolation can be used to find the central match position to a higher precision than the nominal bar pair spacing would allow.
All individual applied registration errors were recovered to within <0.2 mm and <0.2 deg of their nominal values, indicating reliable sub voxel performance. This sub-voxel accuracy supports the finding of a study comparing precisely-known shifts applied to a test object against the co-registration translations and rotations from LGP, in which agreement within 0.2deg and 0.1mm is reported9. A further study using the variation in the coordinates of landmarks to assess IconTM CBCT-to-CBCT co-registration accuracy similarly reports a mean(standard deviation) error of 0.2(0.1)mm10. More recent work by Chung et. al. reports a somewhat larger full system test error of 0.5 ±0.6 mm from 3 tests11. Whilst we report a smaller error of 0.24mm from two tests, given the small sample sizes and expected inter-machine mechanical variation, we consider these results to be consistent. They are further comparable to those of Sarfehnia et. al.9 who report a maximum error of 0.27mm from four end-to-end tests.
Following correction for baseline manufacturing inaccuracies, mean errors across observers were < 0.02 mm and <0.02deg, showing the power of the Vernier scale method to accurately detect geometric misalignment, wherever it may originate from. Interobserver variability (4 observers) on the measurement, as quantified via the standard deviation of residual errors, indicated that X (L-R) and Z (A-P) rotations (s.d. 0.03 deg), along with Z (S-I) axis translations (s.d. 0.03 mm) were recovered with higher precision than Y axis rotations (s.d. 0.08 deg) and X or Y axis translations (s.d. 0.08 and 0.06 mm respectively).
Due to the construction of the phantom, the Z axis translation is measured via the lower resolution 0.2 mm scales set along the cranio-caudal axis. However, the precision of this measurement is not degraded, due to the possibility to assign an intermediate value, where two bar pairs match equally well. In fact, the presence of four scale bars in this axis allows a higher precision measurement than for X and Y axis translations, which are each measured via two in-plane Vernier scales, with 0.1 mm nominal resolution. Whilst in principle, visual interpolation would allow 0.05 mm precision with these scales, yielding similar precision to that observed for Z translation, in practice the voxel grid is too coarse to allow such an interpolation. Therefore the X and Y translation precision is approximately double that of the Z translation.
Rotational accuracy is also axis dependent, due to the construction of the phantom. In all three axes, four scale bars are available to measure the rotational misalignment. However, in the case of Y (A-P) axis errors, the distance from the central axis to the measurement point is 35 mm, vs 65 mm and 74 mm for X and Z axis rotations. This increases the Y axis rotational uncertainty, even given a fixed precision measurement at each scale bar. The reduced distance in this dimension is a result of the shape of the human head, which this test object is designed to approximate.
The ability of this phantom and analysis approach allows sub-voxel analysis of image registration as part of a full system test for GK Icon™. In combination with geometrically and dosimetrically accurate film measurements at known locations, this type of phantom should increase confidence in the ability of CBCT and image registration to deliver highly accurate treatments in the absence of traditional invasive stereotactic immobilisation. This in turn opens the way to multi-fraction SRS with the precision of conventional single fraction treatments.
Comparison of derived couch position errors (FST) and FPT measurements, indicated that the test object was able to separate registration error from overall error and that the residual error was very similar to that derived from the FPT couch positioning test. Therefore it seems reasonable to conclude that the full system error has two significant components (registration and couch positioning) which are both accurately and precisely measured to sub voxel scales by the described FST phantom. Furthermore, overall errors including registration were found to be within manufacturer recommended tolerances.
This phantom allows unequivocal demonstration that the registration accuracy achieved in practice with GK Icon™ is on a scale significantly smaller than that of the CBCT imaging voxels, with no errors larger than the 0.1 mm / 0.1 deg precision of the FST tool. Therefore, given the high precision already demonstrated1,9 for the IFMM intra-fraction motion detection system, the accuracy of mask-based adaptive GK delivery using Icon™ is expected to be comparable to conventional G-frame delivery.Whilst this tool has been optimised and demonstrated for the specific case of Gamma Knife® Icon™, a similar approach with a modified phantom could have application in the commissioning and quality assurance of other SBRT techniques requiring high geometric precision. Further verification would be required in the SBRT setting.
Conclusions
The precision of CBCT driven mask-based stereotactic radiosurgery using GK Icon™ has been validated using a novel full system test object, built as an insert into the RANDO® anthropomorphic head phantom. The use of physical Vernier scales for registration accuracy allows measurement of registration errors with sub-voxel precision. The ability of this method to recover randomly generated artificial registration errors with the correct direction, sign and magnitude has been demonstrated.
In combination with precisely located radiochromic films, this registration error analysis allows separation of registration and mechanical (couch motion) geometric errors. Registration errors are typically < 0.2 mm and 0.2 degrees following automatic RIR within LGP. Couch positioning errors, which sum with registration errors in quadrature, were found to be of similar magnitude. Therefore, the loss of accuracy due to inter-fraction motion, associated with moving from frame to mask based treatment, is likely to be of the order of 0.1 mm and 0.1 degree per degree of freedom. However, it should be noted that intra-fraction patient motion may also degrade the accuracy of mask-based treatments relative to conventional frame-based techniques. Given the sub-voxel level of precision demonstrated, alongside a convenient FST tool for verification of registration, couch positioning and shot delivery performance, increased confidence in the geometric and hence dosimetric precision of mask based stereotactic treatments is possible. The approach to high precision verification of image matching, demonstrated here, could be extended to other (linac based) stereotactic techniques, with appropriate modification.
Acknowledgements
Authors’ disclosure of potential conflicts of interest
Gavin Wright reports attendance at user group meetings of early Icon adopters and meetings organized and hosted by Elekta, and providing consultation services to Elekta for which his department has received a fee. All other authors have nothing to disclose.
Author contributions
Conception and design: Michael Nix, Gavin Wright, Wayne Sykes, Peter Bownes
Data collection: Michael Nix, Gavin Wright, Peter Fallows
Data analysis and interpretation: Michael Nix, Gavin Wright
Manuscript writing: Michael Nix, Gavin Wright
Final approval of manuscript: Michael Nix, Gavin Wright, Peter Fallows, Wayne Sykes, Peter Bownes
References
- 1. Studholme C., Hill D., Hawkes D. An overlap invariant entropy measure of 3D medical image alignment. Pattern Recognit. 1999;32(1):71–86 [Google Scholar]
- 2. Micke A., Lewis D.F., Yu X. Multichannel film dosimetry with nonuniformity correction. Medical Physics 2011;38:2523-2534; doi: 10.1118/1.3576105 [DOI] [PubMed] [Google Scholar]
- 3. van Hoof S.J., Granton P.V., Landry G., Podesta M., Verhaegen F. Evaluation of a novel triple-channel radiochromic film analysis procedure using EBT2. Phys. Med. Biol. 2012;57:4353–4368; doi: 10.1088/0031-9155/57/13/4353 [DOI] [PubMed] [Google Scholar]
- 4. Wright G., Harrold N., Hatfield P., Bownes P. Validity of the use of nose tip motion as a surrogate for intracranial motion in mask-fixated frameless Gamma Knife® Icon™ therapy, Jour. of Radiosurgery and SBRT 2017;4(4):289-301 [PMC free article] [PubMed] [Google Scholar]
- 5. Schönemann PH. A generalized solution of the orthogonal procrustes problem. Psychometrika. 1966;31(1):1-10. doi: 10.1007/BF02289451 [DOI] [Google Scholar]
- 6. Kabsch W. A solution for the best rotation to relate two sets of vectors. Acta Crystallogr Sect A. 1976;32(5):922-923. doi: 10.1107/S0567739476001873 [DOI] [Google Scholar]
- 7. Umeyama S. Least-squares estimation of transformation parameters between two point patterns. IEEE Trans Pattern Anal Mach Intell. 1991;13(4):376-380. doi: 10.1109/34.88573 [DOI] [Google Scholar]
- 8. Schindelin J, Arganda-Carreras I, Frise E, et al. Fiji: an open-source platform for biological-image analysis. Nat Methods. 2012;9(7):676-682. doi: 10.1038/nmeth.2019 [DOI] [PMC free article] [PubMed] [Google Scholar]
- 9. Sarfehnia A., Ruschin M., Chugh B., Yeboah C., Becker N., Cho Y.B., Lee Y. Performance characterization of an integrated cone-beam CT system for dedicated gamma radiosurgery. Med Phys. 2018;29. doi: 10.1002/mp.13073. [Epub ahead of print] [DOI] [PubMed] [Google Scholar]
- 10. Chung H.T., Kim J.H., Kim J.W., Paek S.H., Kim D.G., Chun K.J., Kim T.H., Kim Y.K. Assessment of image co-registration accuracy for frameless gamma knife surgery. PLoS One. 2018;13(3):e0193809. doi: 10.1371/journal.pone.0193809.. eCollection 2018. [DOI] [PMC free article] [PubMed] [Google Scholar]
- 11. Chung H.T., Park W., Tae H.K., Yong K.K., Chun K.J. Assessment of the accuracy and stability of frameless gamma knife radiosurgery. J Appl Clin Med Phys. 2018. Jul;19(4):148-154. doi: 10.1002/acm2.12365.. [DOI] [PMC free article] [PubMed] [Google Scholar]