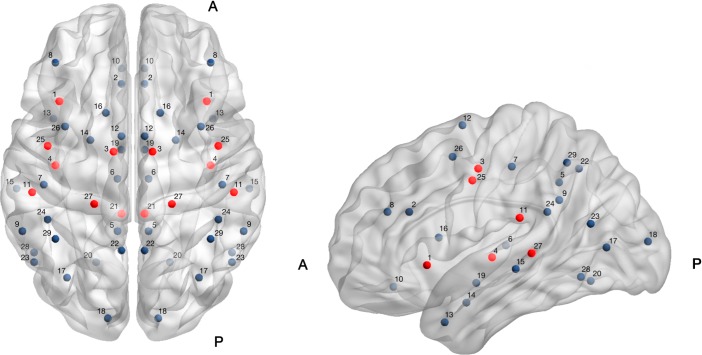
Fig 1.
Axial (left) and sagittal (right) brain maps indicateng the approximate location of 29 homotopic (left and right hemisphere) regions of interest (ROIs) on a template brain. A = anterior; P = posterior; ROIs in red indicate homotopic region-pairs with significantly strengthened functional connectivity using serial measurements of functional connectivity at two time-points; 1-month post-concussion to 5-months post-concussion. Those region-pairs that showed significant strengthening (following FDR correction for multiple comparisons per ROI) included the following: 1 = anterior insula; 3 = middle cingulate, 4 = posterior cingulate, 11 = secondary somatosensory, 21 = spinal trigeminal nucleus, 25 = precentral, 27 = pulvinar. ROIs are plotted using BrainNet Viewer (www.nitrc.org).

