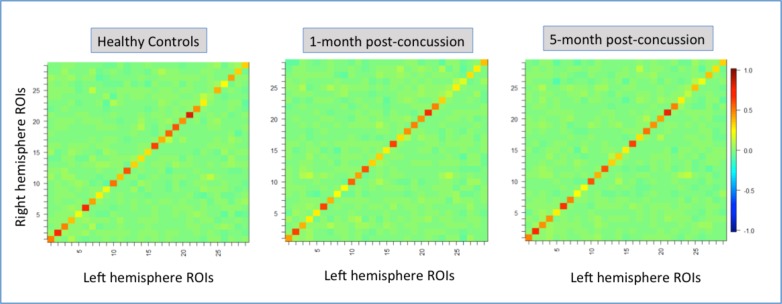
Fig 2.
Connectivity matrixes for 29 homotopic (left and right hemisphere) regions of interest (ROIs) for healthy controls, patients 1-month post-concussion and patients 5-month post-concussion. Hot colors (yellow to red colors) indicate positive functional connectivity patterns. Cold colors light blue to dark blue) indicate negative functional connectivity patterns.

