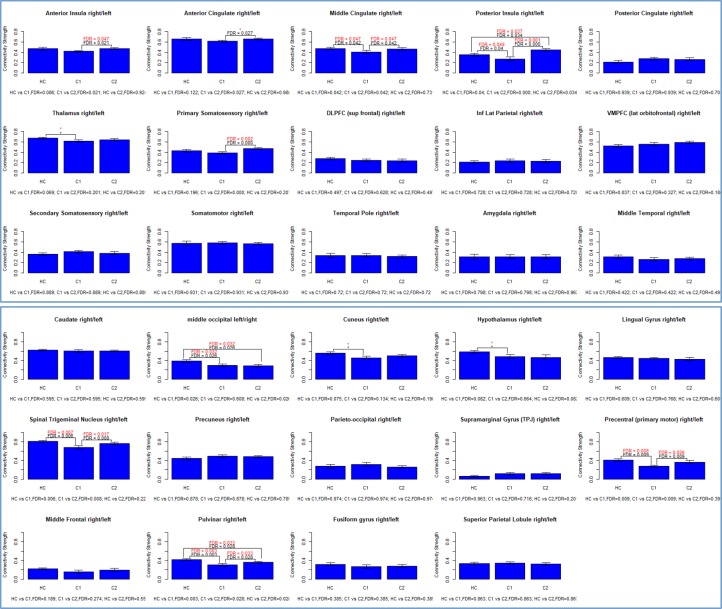
Fig 3. Bar graphs showing the connectivity strength for 29 homotopic regions for healthy controls (HC), concussed patients 1-month post-concussion (time-point CI) and at 5-month post-concussion (time-point CII).
P-values in red ink indicate significance after bootstrapping [32].

