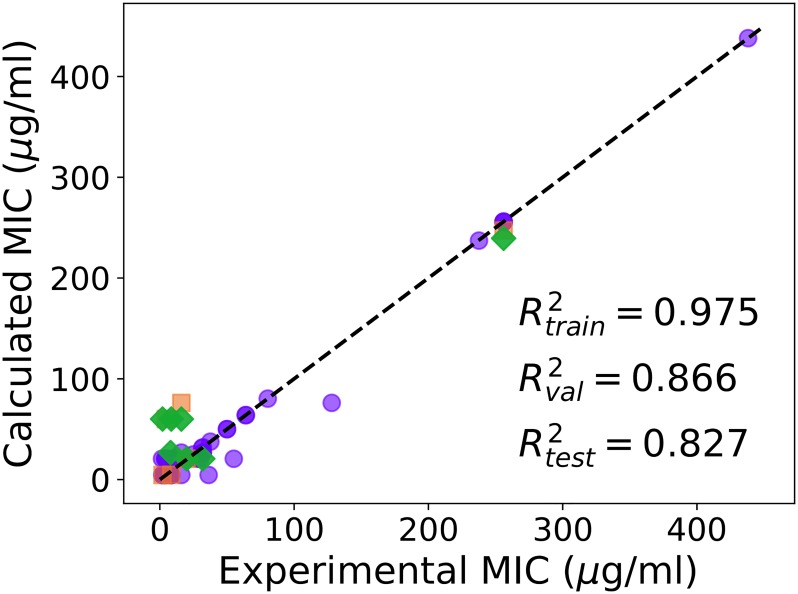
Fig 2. Comparison of the experimental and calculated MIC (μg/ml) of curated AMPs on A. baumannii obtained from Model-1, calculated by using 8 hidden neurons.
Training (purple circles), validation (orange squares) and test (green diamonds) sets are shown. The data used in the analysis is shown in Table 1 in S1 File.

