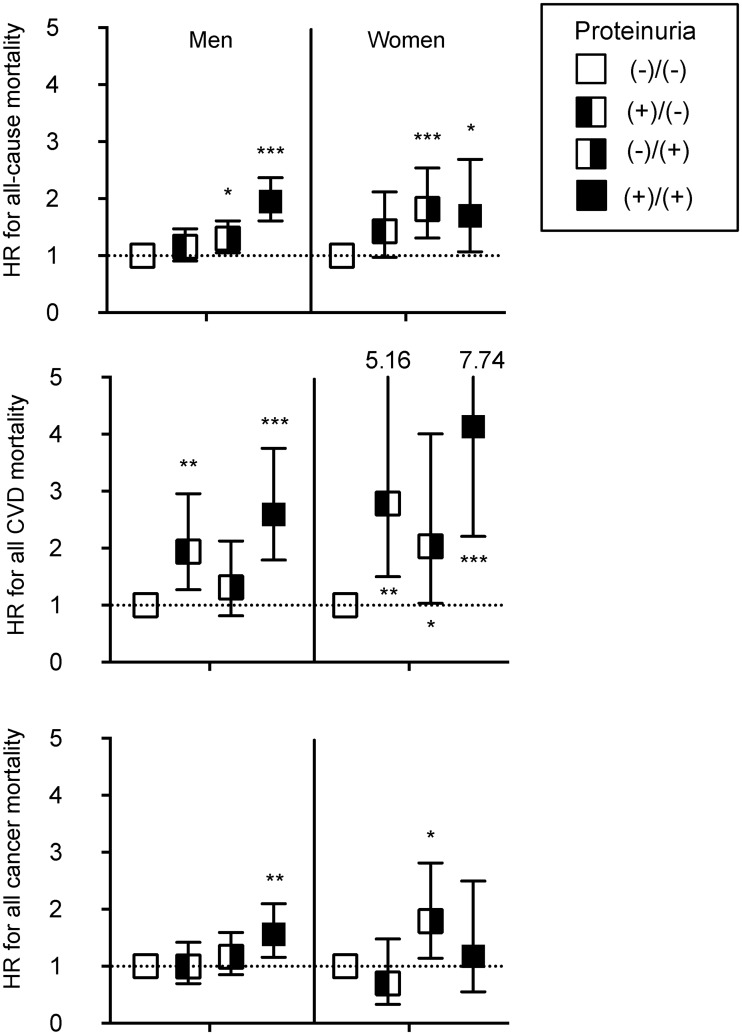
Fig 2. Multiply adjusted hazard ratios for cause-specific mortality with and without CKD determined by proteinuria.
Symbol and error bars indicate multiply adjusted hazard ratios and 95% confidence intervals compared to definitely negative proteinuria (-)/(-) as the reference. Analyses are performed by sex; therefore, corresponding variables are similar to Table 4, except for sex. Abbreviations: CVD, cardiovascular diseases.

