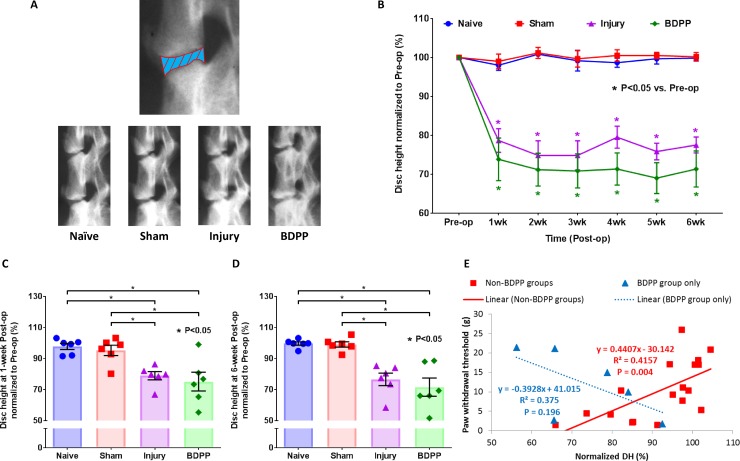
Fig 4. Dietary polyphenols of BDPP did not modulate IVD height loss.
(A) Experimental IVD heights (i.e. L3-6 IVDs) were monitored in live animals by radiography. The top radiograph illustrates IVD height measurement by quantifying the averaged distance of intervertebral space between vertebral boundaries (i.e., the blue part with red boundary lines). The bottom radiographs are representative images of rat lumbar spines across all experimental groups. (B) Changes in IVD height across the duration of the study. Line graph presents the normalized IVD height values, i.e. IVD height at each time point normalizing to corresponding group mean values at baseline, as group mean (±SEM) values. * indicates P<0.05 from Pre-op. (C) and (D) Normalized IVD height at 1-week & 6-week after surgical procedures, respectively. Scatter plots presents withdrawal thresholds of individual animals across the experimental groups (n = 6 for each group). Cross bars present group mean and SEM normalized IVD height. * indicates P<0.05 between groups. (E) Pearson’s correlation analysis between paw withdrawal threshold and normalized IVD height (DH) for Non-BDPP groups (i.e. Naïve, Sham and Injury groups) and BDPP group only from the data obtained at 1-week post-op. Scatter plots present data points of individual animal; solid-trendline presents significant correlation; dotted-trendline presents non-significant correlation.

