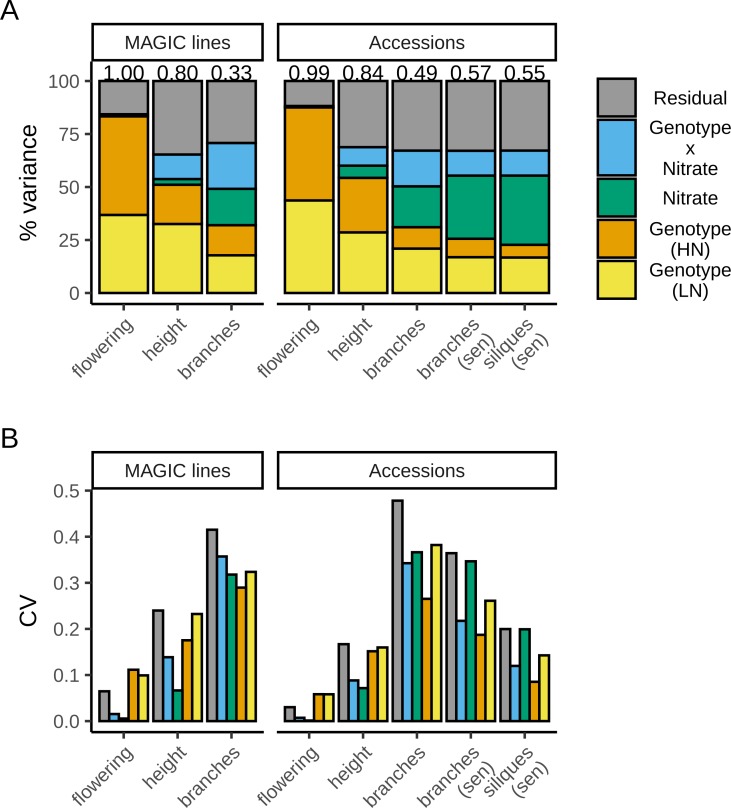
Fig 1. Genetic and non-genetic components of trait variation.
Each trait’s variance was decomposed into genetic and non-genetic components using linear mixed models: genotype-specific effects both on high (HN) and low (LN) nitrate; nitrate-specific effects (environmental component); the response of each genotype to nitrate supply (genotype-by-environment interaction); and unexplained variance (residual). (A) shows the proportion of variance attributed to each component for each trait and (B) shows the magnitude of this variance relative to each trait’s mean, using the coefficient of variation (the estimated variance divided by the squared mean of the respective trait). Measurements of height and branch number were taken when the plants had two expanded siliques. For the accessions, the total number of branches was also scored at the senescence stage (sen), together with the total number of siliques. Variance components were estimated using data from 374 MAGIC lines and 297 (2 silique stage) or 278 (senescence stage) accessions with n = 4–8 replicates for each line on each nitrate treatment (median n = 8). Detailed results from these models are shown in S2 Table.

