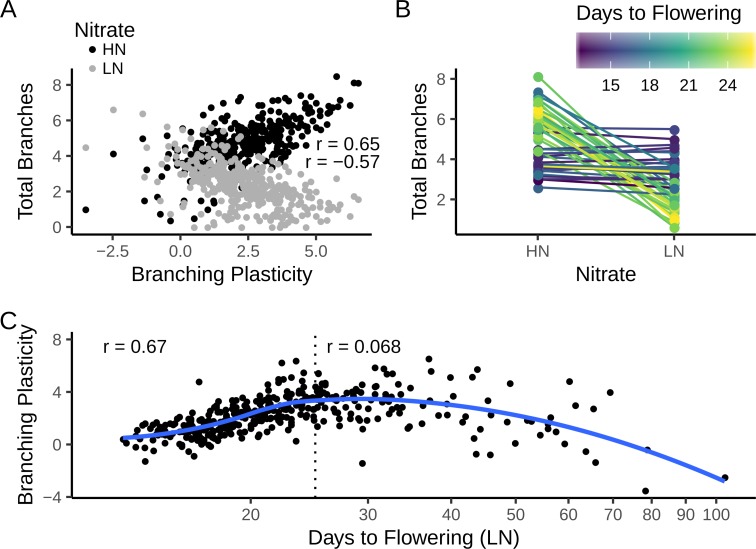
Fig 3. Trait correlations in the MAGIC lines.
(A) Correlation between mean shoot branching plasticity and mean number of branches under low (LN) and high (HN) N supply. Pearson’s correlation coefficient (r) for each treatment is shown in the panels. The 95% confidence intervals are: r(LN) = -0.57 [-0.63, -0.49], p ~ 1−33; r(HN) = 0.65 [0.59, 0.71], p ~ 10−46. (B) Reaction norm plots of the number of branches for the 25 least and most plastic lines. Lines are coloured by the average days to flowering of each MAGIC line. (C) Correlation between mean days to flowering and branching plasticity. The blue line is a smoothed trend fitted by local regression (LOESS). The dotted line shows a cut-off of 25 days to flowering on LN. Pearson’s correlation coefficients are shown for all 374 lines (r = 0.068 [-0.033, 0.17], p = 0.19) and for 258 early-flowering lines only (r = 0.67 [0.60, 0.73], p ~ 1−35). In all panels, data are means from n = 4–8 replicates of each line (median n = 8). Note the log-scaled x axis on panel C.

