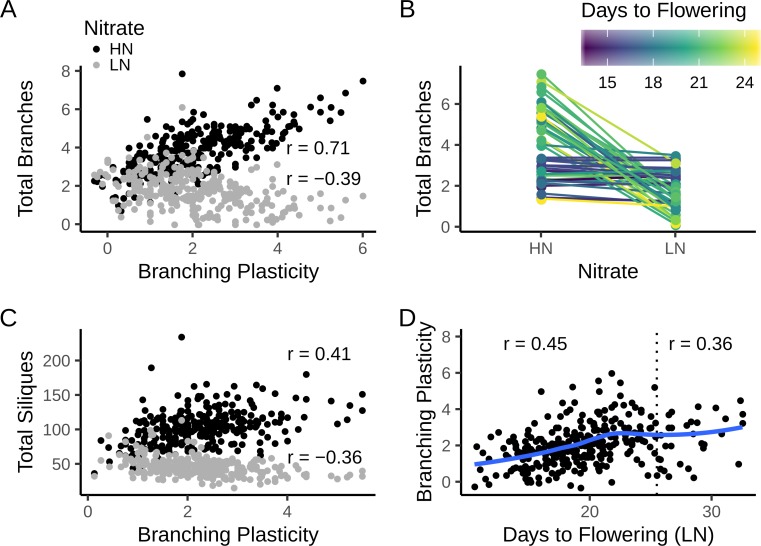
Fig 4. Trait correlations in the natural accessions.
(A) Correlation between mean shoot branching plasticity and mean number of branches under low (LN) and high (HN) N supply at the 2-silique stage for 297 accessions. Pearson’s correlation coefficient (r) is shown for each nitrate treatment. The 95% confidence intervals are: r(LN) = -0.39 [-0.48, -0.29], p ~ 10−12; r(HN) = 0.71 [0.65, 0.76], p ~ 10−47; (B) Reaction norm plots of the number of branches for the 25 least and most plastic lines. Lines are coloured by the average days to flowering of each accession. (C) Correlation between mean shoot branching plasticity and total number of siliques produced at the senescence stage for 278 accessions. Pearson’s correlations and 95% CI: r(LN) = -0.36 [-0.46, -0.26], p ~ 10−10; r(HN) = 0.41 [0.31, 0.50], p ~ 10−13 (D) Correlation between mean days to flowering and branching plasticity. The blue line is a smoothed trend fitted by local regression (LOESS). The dotted line shows a cutoff of 25 days to flowering on LN. Pearson’s correlations are shown for all 297 accessions (r = 0.36 [0.26, 0.46], p ~ 10−10) and for 266 early-flowering accessions only (r = 0.45 [0.34, 0.54], p ~ 10−14). In all panels, data are means from n = 4–8 replicates of each accession (median n = 8).

