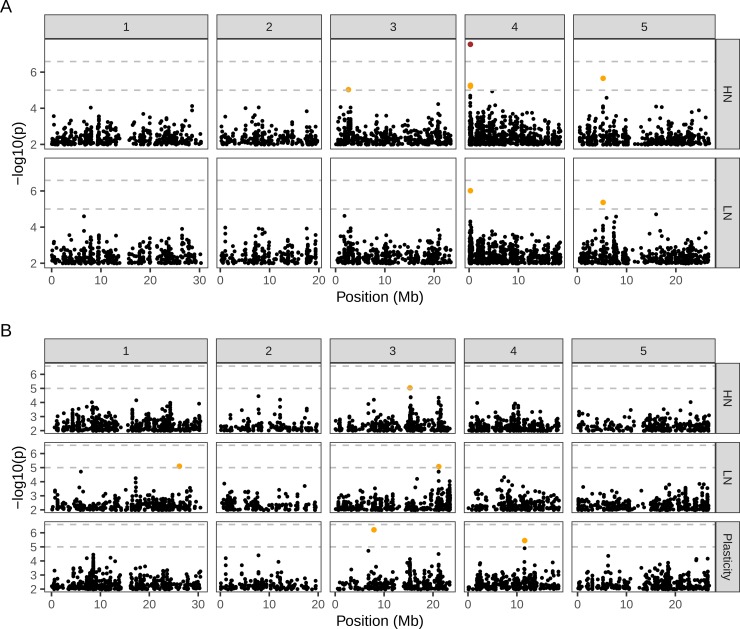
Fig 8.
QTL mapping for days to flowering (A) and shoot branching (B) in accessions. Manhattan plots showing the association mapping results for each trait on high (HN) and low (LN) nitrate. For shoot branching, QTL mapping was also performed for this trait’s plasticity. The upper horizontal dashed line is the 5% genome-wide significance threshold, obtained with bonferroni correction; one SNP above this threshold is shown in red. The lower line, at p = 10−5, was defined based on the inclusion of two known QTL for flowering time; SNPs above this relaxed threshold are shown in orange. The association test was carried out using a linear mixed model that corrects for population structure by taking into account the genetic relatedness between individuals [114]. The tests used 192863 bi-allelic SNPs that had >5% frequency in our sample of 240 early flowering accessions scored at 2-silique stage (flowering <25 days on LN).

