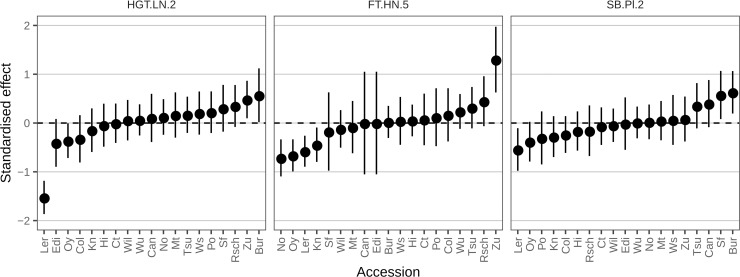
Fig 9. Predicted parental effects for QTL identified in this work.
The QTL are named as in S4 Fig, Fig 7 and S1 Table. The points and error bars are the mean and 95% confidence intervals of the Best Linear Unbiased Predictors (BLUPs) of the 19 haplotype effects estimated using the R/qtl2 package [43]. The y-axis shows the standardized QTL effect (i.e. the values indicate how many standard deviation units each estimate deviates from the trait’s mean).

