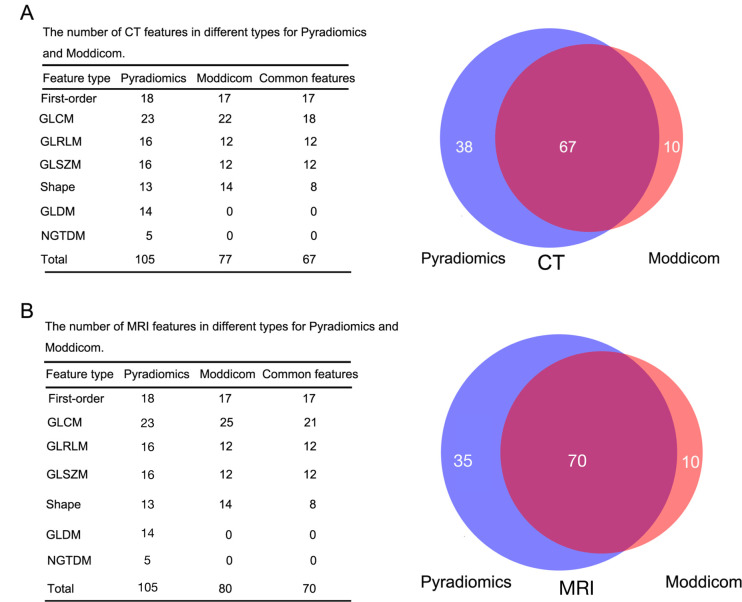
Figure 1.
The number of CT and MRI features in each type for Pyradiomics and Moddicom. A: CT data set; B: MRI data set. The blue color represents Pyradiomics, while the red colour represents Moddicom. The cross-areas indicate the common features. GLCM, grey level co-occurrence matrix; GLRLM, grey level run length matrix; GLSZM, grey level size zonematrix; GLDM, grey level difference matrix; NGTDM, neighbouring grey tone difference matrix.

