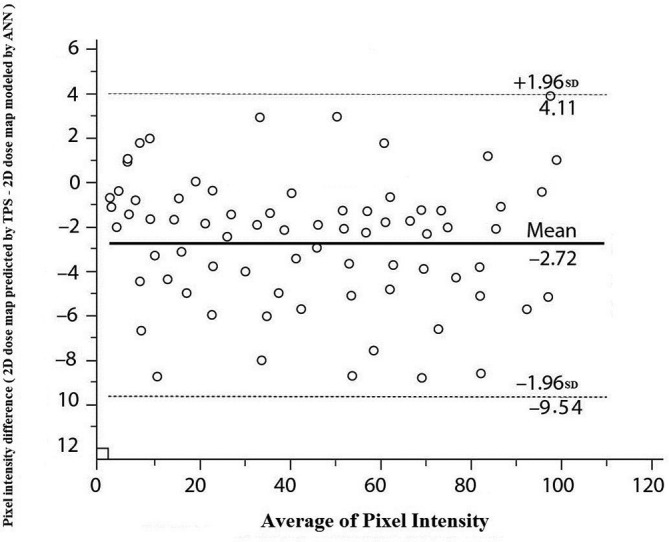
Figure 4.

Bland–Altman plots of difference in pixel intensity between target (2D dose map predicted by TPS) and output (2D dose map modeled by ANN) data in validation phase of designed ANN. Solid horizontal lines is mean difference and dashed lines is the 95% limits of agreements (±1.96 SD of the difference). 2D,two-dimensional; ANN, artificial neural network; SD, standard deviation; TPS, treatmentplanning system.
