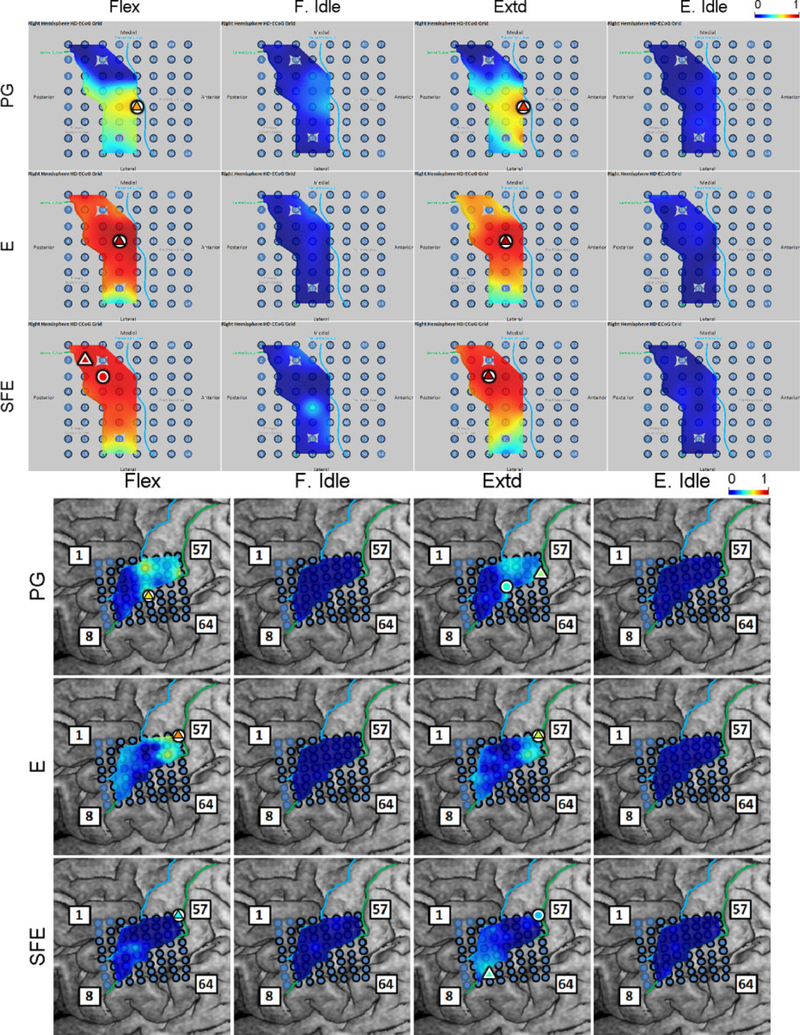
Fig. 29.
Spatial maps of the per-channel coefficient of determination (r2) between DM and WM aggregated across all movement events and speeds for Subjects 1 and 3. Circle: core electrode. Triangle: electrode with the highest r2 for each panel. The color of each symbol indicates the electrode’s r2 value.

