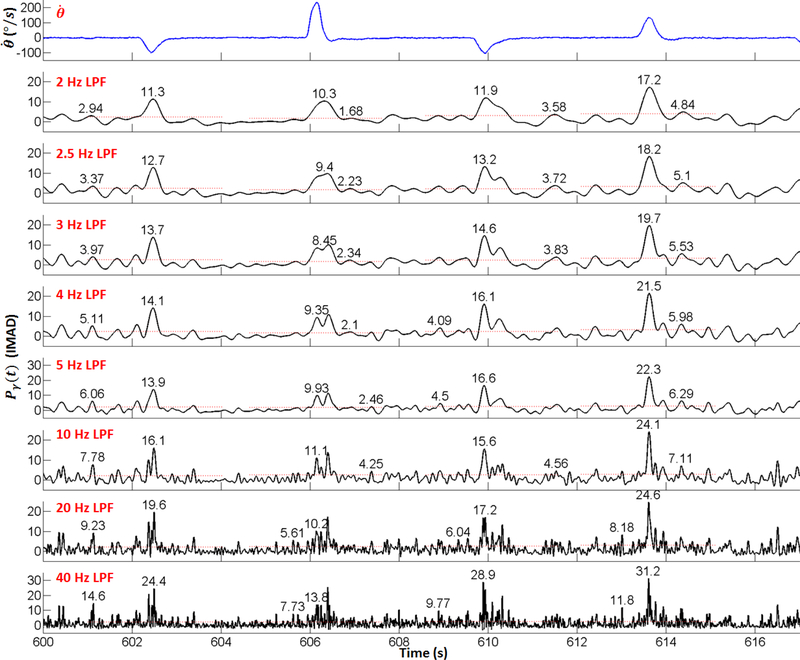
Fig. 40.
Time movement velocity ω and Pγ signal at electrode #24 during Subject 2’s PG experiment runs. Red dashed lines: The local MAD (LMAD) thresholds estimated from local idling periods around each flexion or extension. Numbers denote the peak amplitudes during movement and local idling periods.

