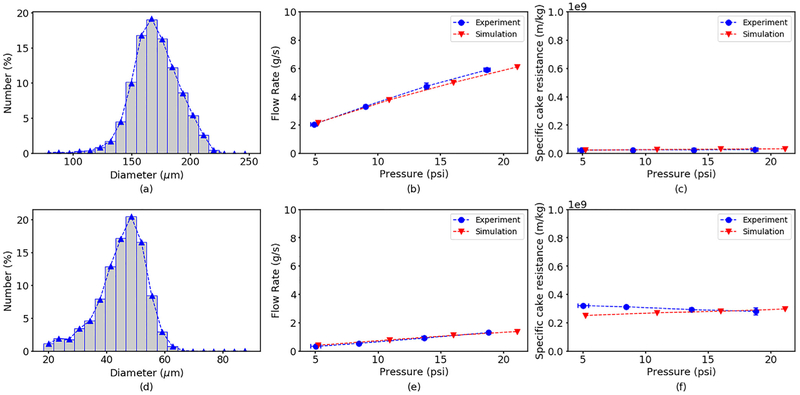
Fig. 3.
(Top) Comparison of experimental and simulation results for glass beads with SMD of 175 μm. (Bottom) Comparison of experimental and simulation results for glass beads with SMD of 48 μm, (a)(d) Particle size distributions by number percent measured using a brightfield microscope. (b)(e) Filtrate mass flow rate as a function of applied pressure. (c)(f) Specific cake resistance as a function of pressure. Error bars denote standard errors of three replicate experiments.

