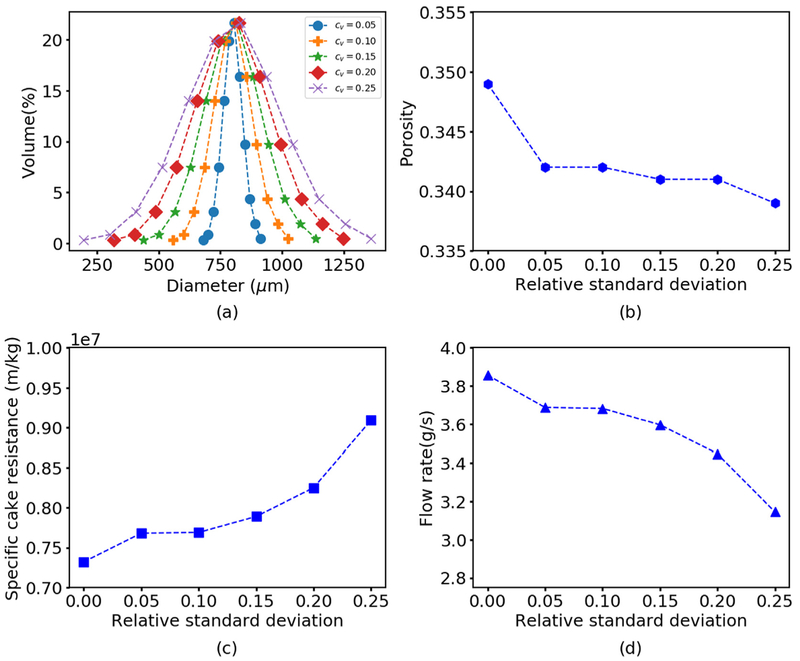
Fig. 7.
Predicted effect of the particle size distribution on filtration performance for polydisperse spheres. (a) Varying particle size distributions by volume percent with the same mean diameter and different standard deviation. Corresponding model predictions of (b) average cake porosity (c) specific cake resistance and (d) filtrate flow rate as a function of the relative standard deviation cv , defined as standard deviation divided by the mean particle diameter.

