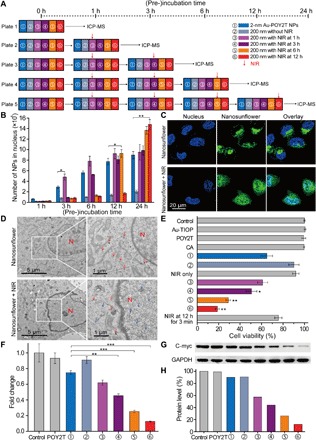
Fig. 4. Controlled nucleus localization and gene silencing study in vitro of the self-assembled nanostructures.

(A) Schematic of the in vitro cell experimental setup for the controlled NP nucleus localization and gene regulation study. (B) Number of 2-nm Au-POY2T NPs localized in the MCF-7 cell nucleus with treatment of ① individual 2-nm Au-POY2T NPs, ② 200-nm nanosunflowers, and 200-nm nanosunflowers with NIR irradiation (10 min) after different preincubation times (③ 1, ④ 3, ⑤ 6, and ⑥ 12 hours). Mean values ± SD, n = 3. Statistical differences were determined by two-tailed Student’s t test; *P < 0.05 and **P < 0.01. (C) Confocal observation of distribution of fluorescein isothiocyanate–labeled nanosunflowers (green) before (top) and after (bottom) NIR irradiation in MCF-7 cells. Nucleus was labeled by 4′,6-diamidino-2-phenylindole (blue). (D) Bio-TEM image of the localization of large-sized nanosunflowers (top, red arrow) in the cytoplasm and distribution of released small NPs (bottom, blue arrow) in cytoplasm and nucleus after NIR irradiation in MCF-7 cells. (E) Cytotoxicity evaluation of MCF-7 cells with treatment of 200-nm nanosunflowers after NIR irradiation (after a period of preincubation time: 1, 3, 6, and 12 hours, respectively) compared to control, 2-nm Au-TIOP NPs, POY2T sequence, CA sequence, 2-nm Au-POY2T NPs, 200-nm nanosunflowers without NIR irradiation, and NIR exposure only. All the concentrations of treatments were at or equal to 1 μM in POY2T sequence and were tested after a total of 24 hours of incubation. Mean values ± SD, n = 3. Statistical differences were compared with the treatment group of ① individual 2-nm Au-POY2T NPs determined by two-tailed Student’s t test; *P < 0.05 and **P < 0.01. (F) C-myc mRNA level determined by real-time PCR after different treatments as described above. Mean values ± SD, n = 3. Statistical differences were determined by two-tailed Student’s t test; **P < 0.01 and ***P < 0.001. (G) C-myc protein levels determined by Western blot and (H) corresponding quantitative histogram after different treatments as described above. GAPDH, glyceraldehyde phosphate dehydrogenase.
