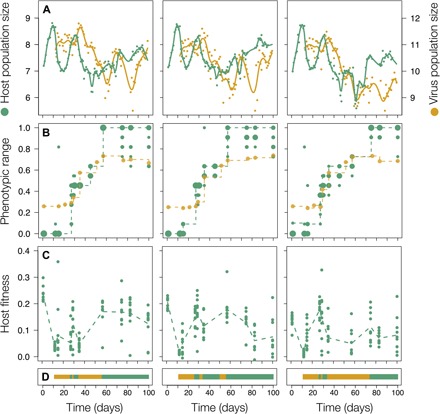
Fig. 1. Ecological and evolutionary change of coevolving host and virus populations.

The three columns correspond to three replicate experiments. (A) Population sizes of host (green, first vertical axis) and virus (orange, second vertical axis) were assessed daily (dots, total population size, log10 scale) and smoothed using cubic splines (lines). (B) Phenotypic evolution of resistance (green), i.e., the proportion of virus populations from all time points a host is resistant to, with circle size corresponding to the number of clones with the same phenotype and of infectivity (orange), i.e., the proportion of host individuals a virus population can infect. Dotted lines represent the maximum range per time point that was maintained at consecutive time points. Assays were done for 1320 comparisons of 10 host clones and one virus population collected from, respectively, 12 and 11 time points. (C) Fitness (growth rate per day in the presence of contemporary virus) of host individuals. (D) Binary visualization of the phenotypic interaction, with orange indicating a phenotypic match and green indicating a mismatch.
