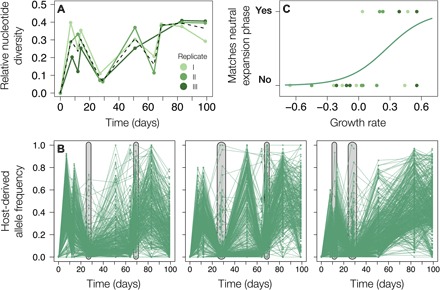
Fig. 3. Adaptation and population expansion reciprocally influence each other.

(A) Nucleotide diversity for the host populations was calculated per time point using derived allele frequencies of all loci that exhibited variation over the time course of the experiments. Lines are colored by replicate, with the black dashed line indicating the average. (B) Host allele frequency trajectories of all derived SNPs, with every line corresponding to an SNP. Distributions of VAFs match expectations under a neutral population expansion (Luria-Delbrück model) at the time points highlighted in gray. (C) Indicator variable reflecting if the distributions of VAFs in the host population matched the expectations of a neutral expansion phase (y axis) plotted against population growth in the 3 days leading up to the corresponding time point. Every dot reflects a time point and is colored by replicate, and the line corresponds to a generalized linear model fit with replicate as random effect.
