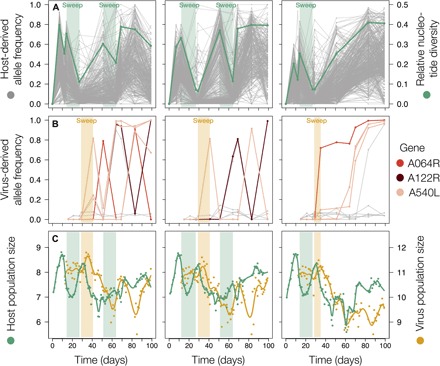
Fig. 4. Repeatable selective sweeps match periods of population expansions in both populations.

(A) Allele frequency trajectories of all derived SNPs are plotted for the host in gray (first vertical axis). Sweeps are evidential by a decrease in relative nucleotide diversity (second vertical axis), plotted in green. Light green highlight indicates the host sweeps identified. (B) Derived allele frequency trajectories for the virus. Gray lines reflect trajectories of mutations observed in one replicate only. Colored lines indicate trajectories of variants that were observed in more than one replicate, colored by the gene they occur in. Light orange highlight indicates the first virus sweep that occurs at the same time in all three replicates. (C) Population sizes of host (green) and virus (orange) were assessed daily (dots, total population size, log10 scale) and smoothed using cubic splines (lines). Light green and orange shadings indicate periods that match with sweeps as indicated in (A) and (B).
