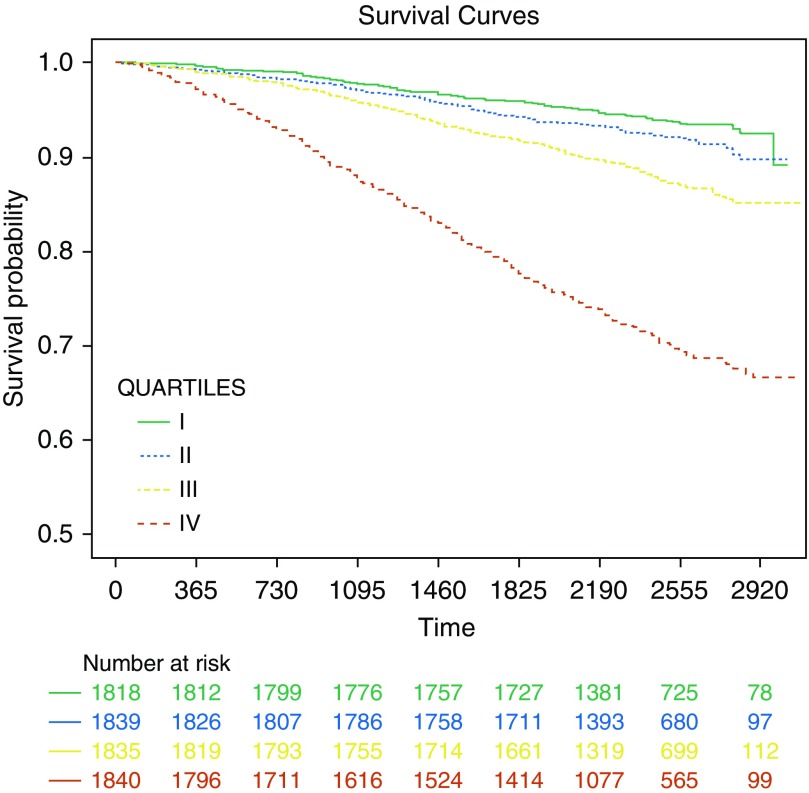
Figure 3.
Kaplan-Meier survival curves for the four quartiles of Peak Index. After adjustment for age, sex, race, body mass index, current smoking status, and pack-years of smoking, compared with the lowest quartile (I), the higher quartiles were associated with greater risk of mortality (adjusted hazard ratio [HR], 1.10; 95% confidence interval [CI], 0.86–1.41; P = 0.441; adjusted HR, 1.50; 95% CI, 1.19–1.90; P = 0.001; and adjusted HR, 3.41; 95% CI, 2.75–4.23; P < 0.001, respectively).

