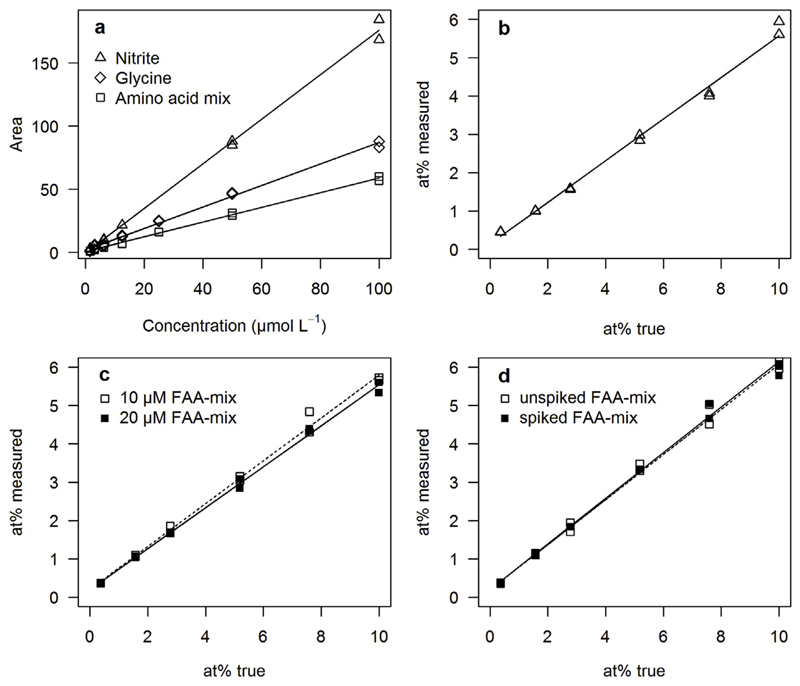
Fig. 2.
Concentration and isotope calibration of the method based on purge-and-trap isotope ratio mass spectrometry (PT-IRMS) method. (a) Increment of N2O peak area (Vs) with concentration of nitrite (slope = 1.76, r2 = 0.997, n = 2), glycine (slope = 0.85, r2 = 0.995, n = 2) and amino acid mix (slope = 0.58, r2 = 0.998, p < 0.001, n = 2) and isotope calibration for (b) nitrite (20 μM, slope = 0.51, r2 = 0.994, n = 2). (c) 10 μM FAA-mix (slope = 0.56, r2 = 0.995, n = 2, dashed line) and 20 μM FAA-mix (0.53, r2 = 0.9974, n = 2, solid line). (d) Isotope calibration for 10 μM FAA-mix (slope = 0.59, r2 = 0.997, n = 2, dashed line) and spiked 1 μM FAA-mix (slope = 0.60, r2 = 0.995, n = 2, solid line).

