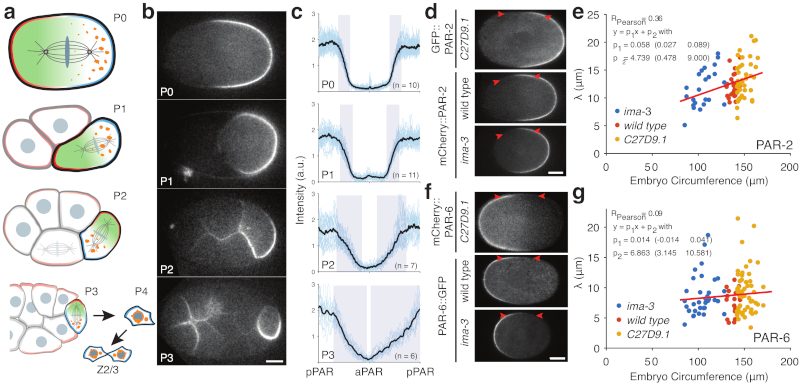
Figure 3. PAR boundary gradients fail to scale with cell size.
a) Schematic of PAR protein localisation in P lineage cells P0, P1, P2, and P3 (pPAR - cyan, aPAR - red). In each of these cells PAR proteins set up a cytoplasmic MEX gradient (green) that drives asymmetric segregation of germline fate determinants (orange) into a single P lineage daughter cell. The final P lineage cell, P4, divides symmetrically to yield the germline stem cells Z2/Z3. See Supplementary Movie S2. (b) Sample midplane images of PAR-2 in P0, P1 (dissected), P2, and P3 used for gradient measurements. (c) Individual and average plots of PAR-2 distributions in P0, P1 (dissected), P2 and P3 cells, showing that the domain boundary interface occupies a proportionally larger fraction of the circumference in smaller cells. Note full circumferential profiles around the entire cell are shown, normalized to cell circumference. Shaded regions highlight the interface regions between domains. Center of pPAR domain at x = 0, 1 and center of aPAR domain at x = 0.5. (d) Sample midplane images of PAR-2 at nuclear envelope breakdown in C27D9.1, wild-type, or ima-3 P0 embryos, with arrowheads highlighting the boundary region. (e) Plot of interface width vs embryo size for PAR-2 in C27D9.1 (yellow, n=41), wild-type (red, n=30), or ima-3 (blue, n=23) P0 embryos. (f,g) Same as (d,e) but for PAR-6. Note that the interface width is effectively constant across a twofold size range. Sample sizes: C27D9.1 (yellow) n = 56, wild-type (red) n=20, ima-3 (blue) n=36. Example fits shown in Supplementary Figure S3. Scale bars, 10 µm.

