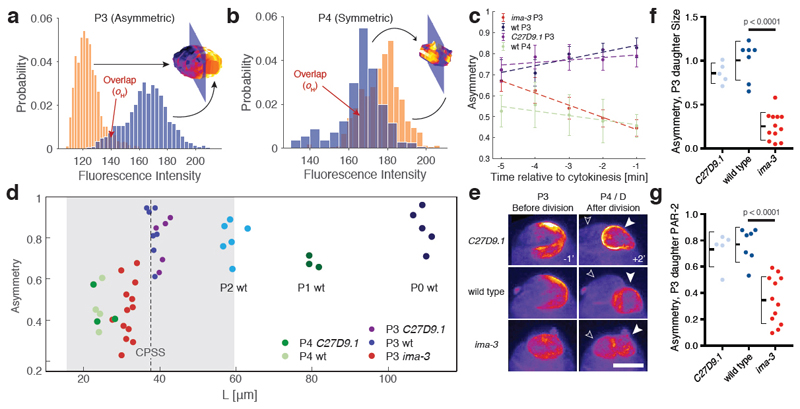
Figure 5. Decreased P3 cell size in small embryos destabilizes polarity and induces premature loss of division asymmetry.
(a) Histogram of GFP::PAR-2 fluorescence values (yellow and blue bars) taken from the surface of the two cell halves bisected by the plane that maximizes asymmetry of the cell shown. Histogram overlap (oH) is highlighted. (b) Same as (a), but for a wild-type P4 cell that divides symmetrically. (c) Plots of PAR-2 asymmetry (1 - oH) by cell type or condition as a function of time before cytokinesis onset. Note loss of asymmetry in small ima-3 P3 cells as they approach division. Mean ± SEM shown. (d) Plot of asymmetry vs. cell size for P lineage cells taken from wild-type or genetically-induced large or small embryos. Vertical dashed line indicates predicted CPSS calculated from experimental parameters, with grey region denoting 95% CI estimate from parameter measurement variance. Measurements are taken 1 min before onset of cytokinesis. Sample sizes: P4 C27D09.1 n= 3, P4 wt n=4, P3 ima-3 n=13, P3 C27D9.1 n=5, P3 wt n=7, P2 wt n=6, P1 wt n=3, P0 wt n=5. (e) Z projections of GFP::PAR-2 in P3 cells 1 min prior to cytokinesis (-1) and the resulting daughter cells 2 min. after (+2’). Solid and outlined arrowheads denote P4 and its sister D. Note PAR-2 is inherited symmetrically between the presumptive D and P4 cells in ima-3 embryos. See Supplementary Figure S4, Movie S3 and Table S1. Scale bar, 5 µm. (f-g) ima-3 embryos exhibit reduced asymmetry in size (f) and GFP::PAR-2 fluorescence (g) between P3 daughter cells. Same samples as in (d), except one ima-3 cell could not be followed for sufficient time after division. Two sample t-test, two-tailed. Mean ± STD indicated.

