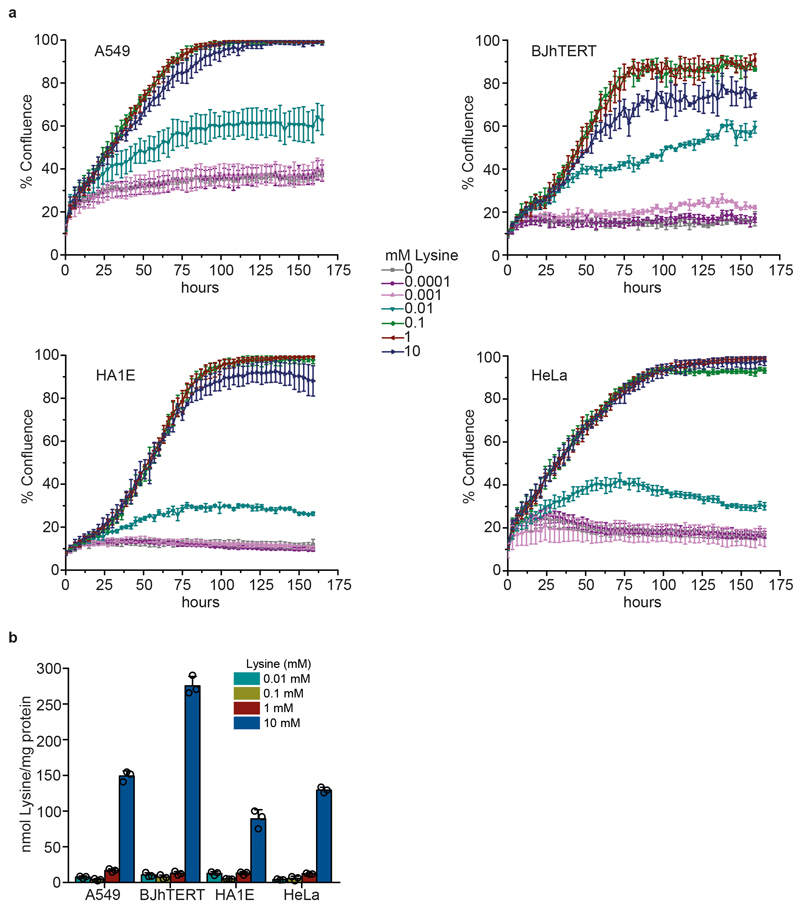
Extended data Figure 6. Effect of lysine supplementation on mammalian cell lines that are auxotrophic for lysine.
a, Growth curves showing the effect of different concentrations of lysine (0.01-10 mM) on mammalian cell growth. Percentage confluence was calculated using IncuCyte imaging system (Essen Bioscience). The data represent mean ± s.d.; n= 3 biologically independent samples. b, Intracellular lysine concentrations in different mammalian cell lines grown in DMEM with a range of concentrations of lysine (0.01-10 mM). Cells were seeded at 0.5 x 10⁶ cells per 6- cm plate and grown for 48 h before collection. The data represent mean ± s.d.; n = 3 biologically independent samples.

