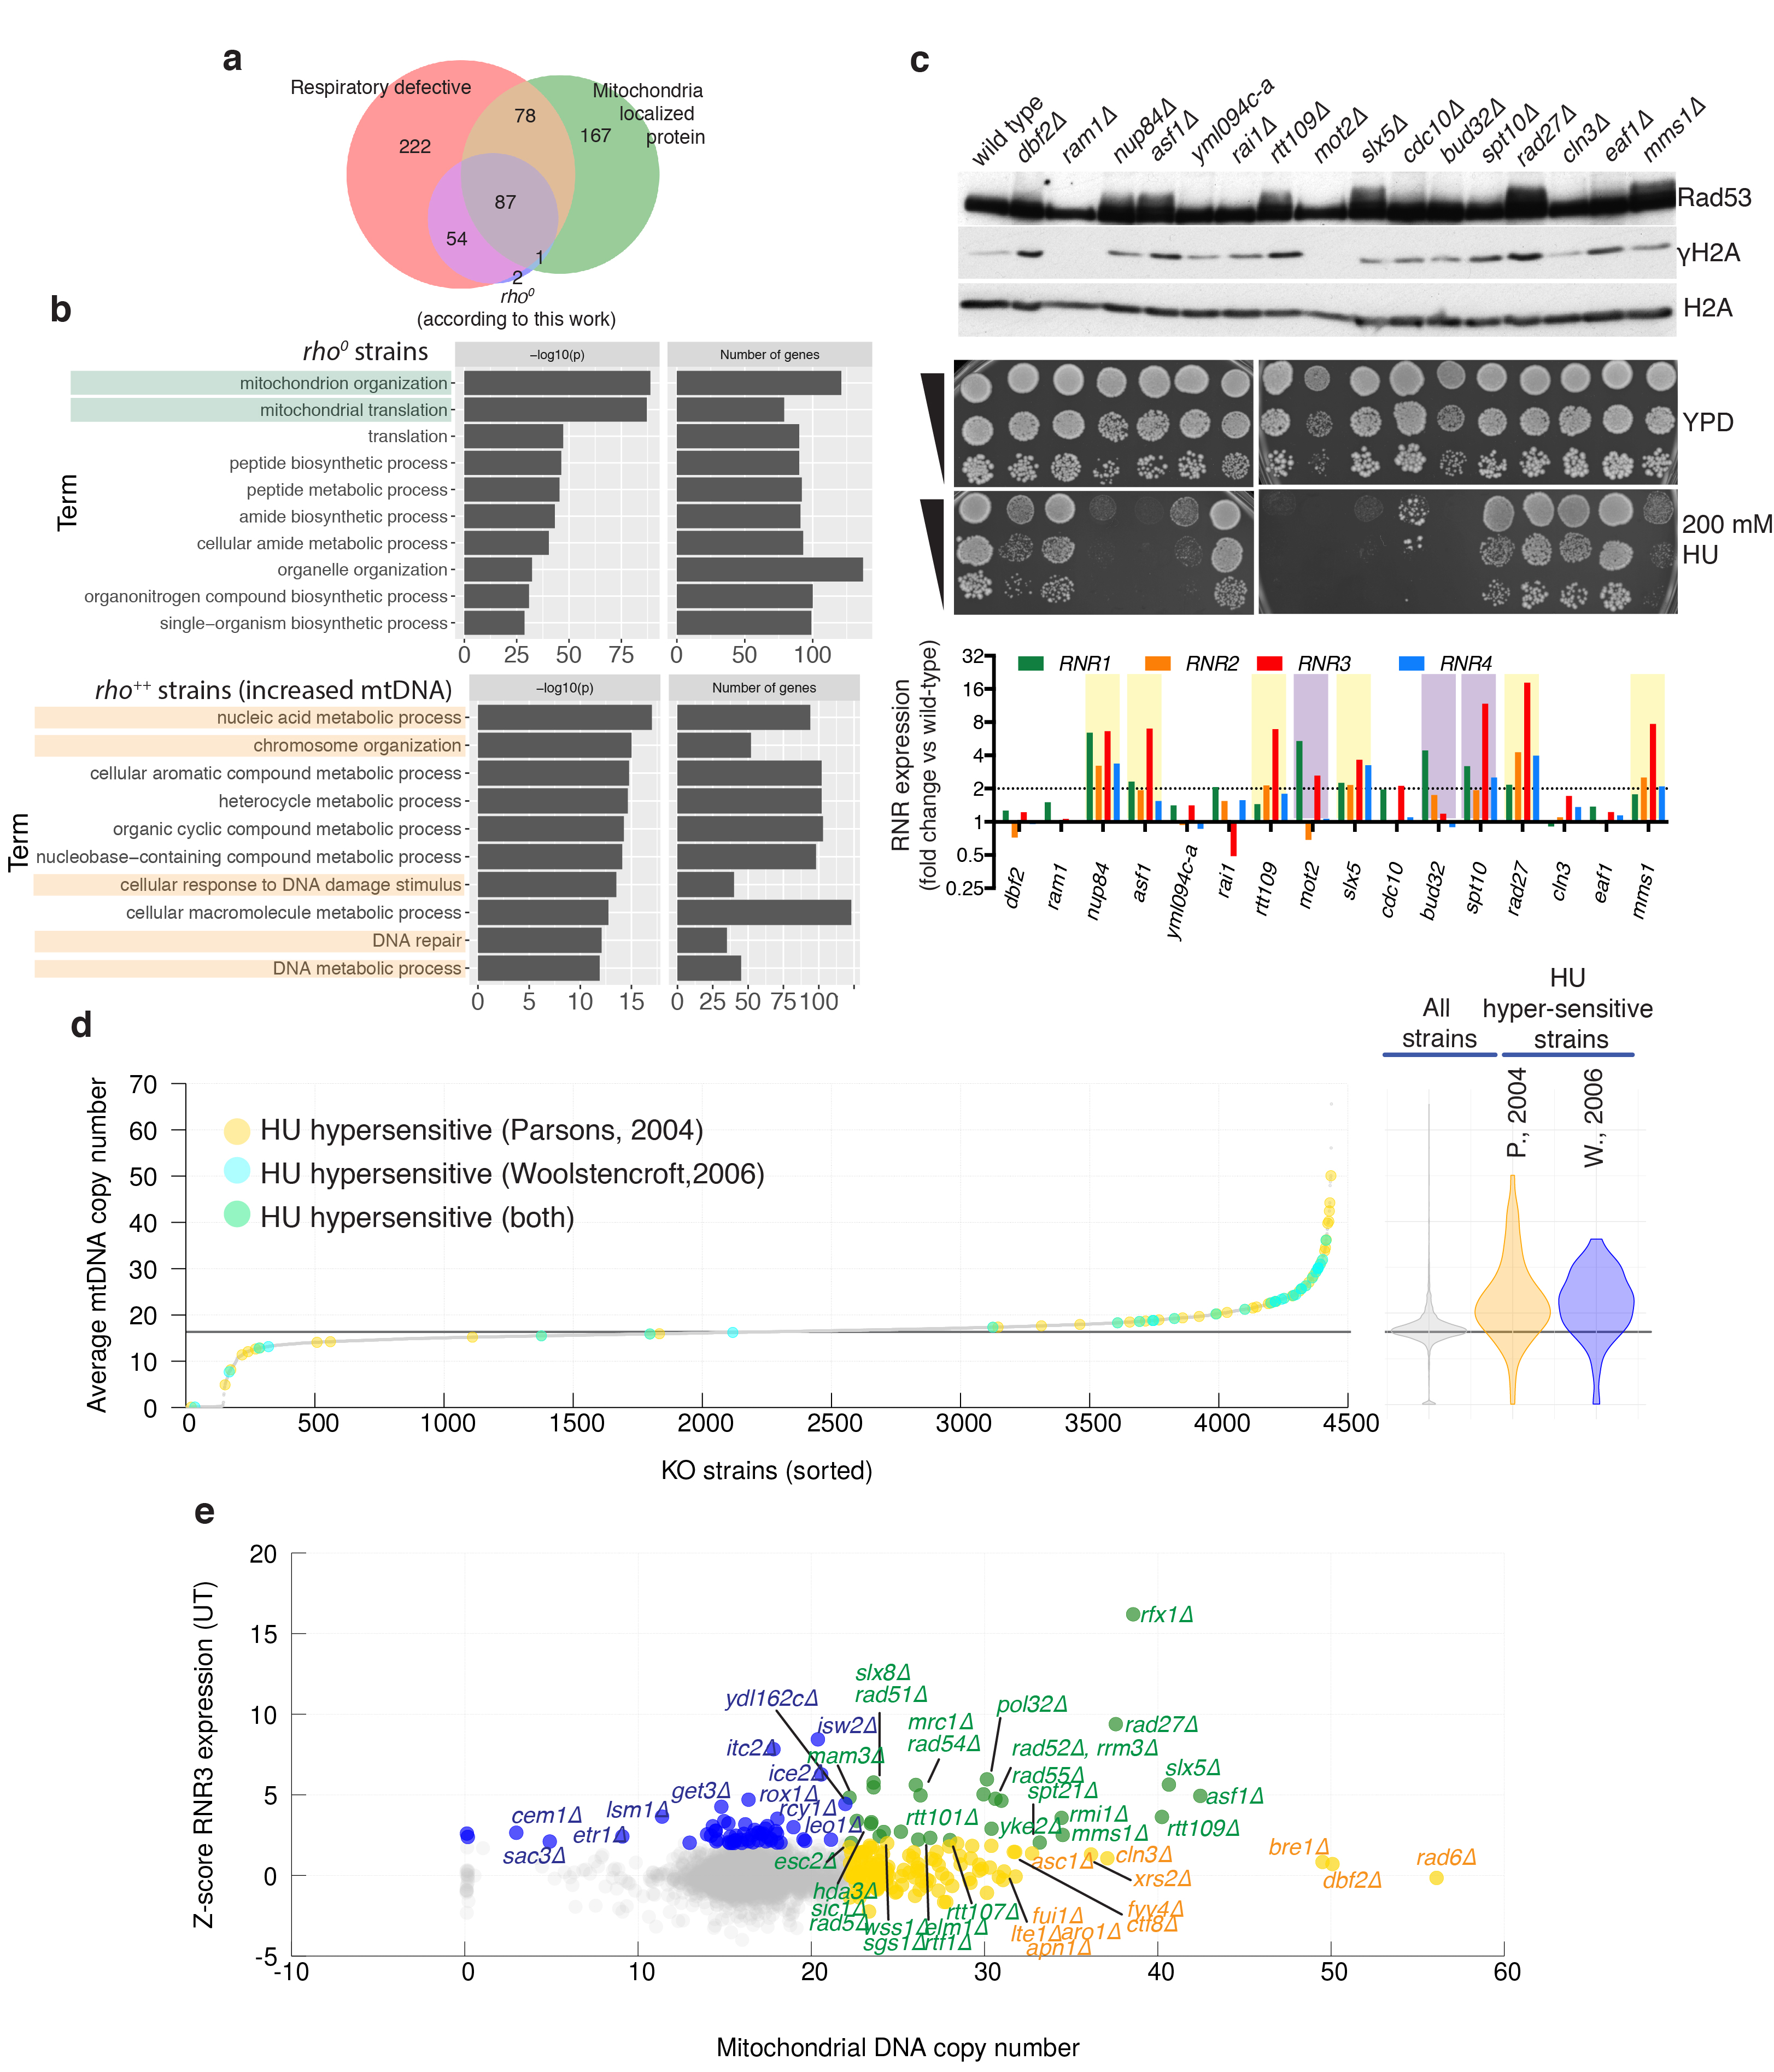
Extended Data Figure 6. Connections between mtDNA and nuclear genome alterations.

(a) Venn diagram showing overlap between genes identified as rho0 by our sequencing, genes encoding mitochondria proteins (source48), and gene knockouts for which respiratory growth was annotated as ‘absent’ (source SGD: http://www.yeastgenome.org). (b) Gene-ontology of rho0 strains (estimated mtDNA copy number <1) and rho++ strains (estimated mtDNA copy number >20.3; Bonferroni corrected p-values). (c) Sixteen gene-knockouts from the top end of the mtDNA distribution were assessed for spontaneous DDR activation by Rad53 and histone H2A phosphorylation (representative images from two technical replicates, source data in Supplementary Figure 1), and RNR expression (average from 3 technical replicates, one biological sample per strain). Strains with increased RNR expression (violet) or increased RNR expression and Rad53 hyperphosphorylation (yellow) are highlighted. Serial dilutions of the same cultures were also tested for hydroxyurea (HU) sensitivity. (d) Comparisons of mtDNA estimates with systematic analysis of HU sensitivity; HU-sensitive strains are highlighted in different colours depending on the study (Parsons: n=62 and Woolstencroft: n=33 biologically independent samples). (e) Comparison of predicted mtDNA copy-number and RNR3 expression levels: KOs with increased Rnr3 protein levels (blue, Z-score >2); KOs with increased mtDNA (yellow, mtDNA >22.2); KOs with both measures increased (green); n=4436 by KO averages of n=8843 biologically independent samples.
