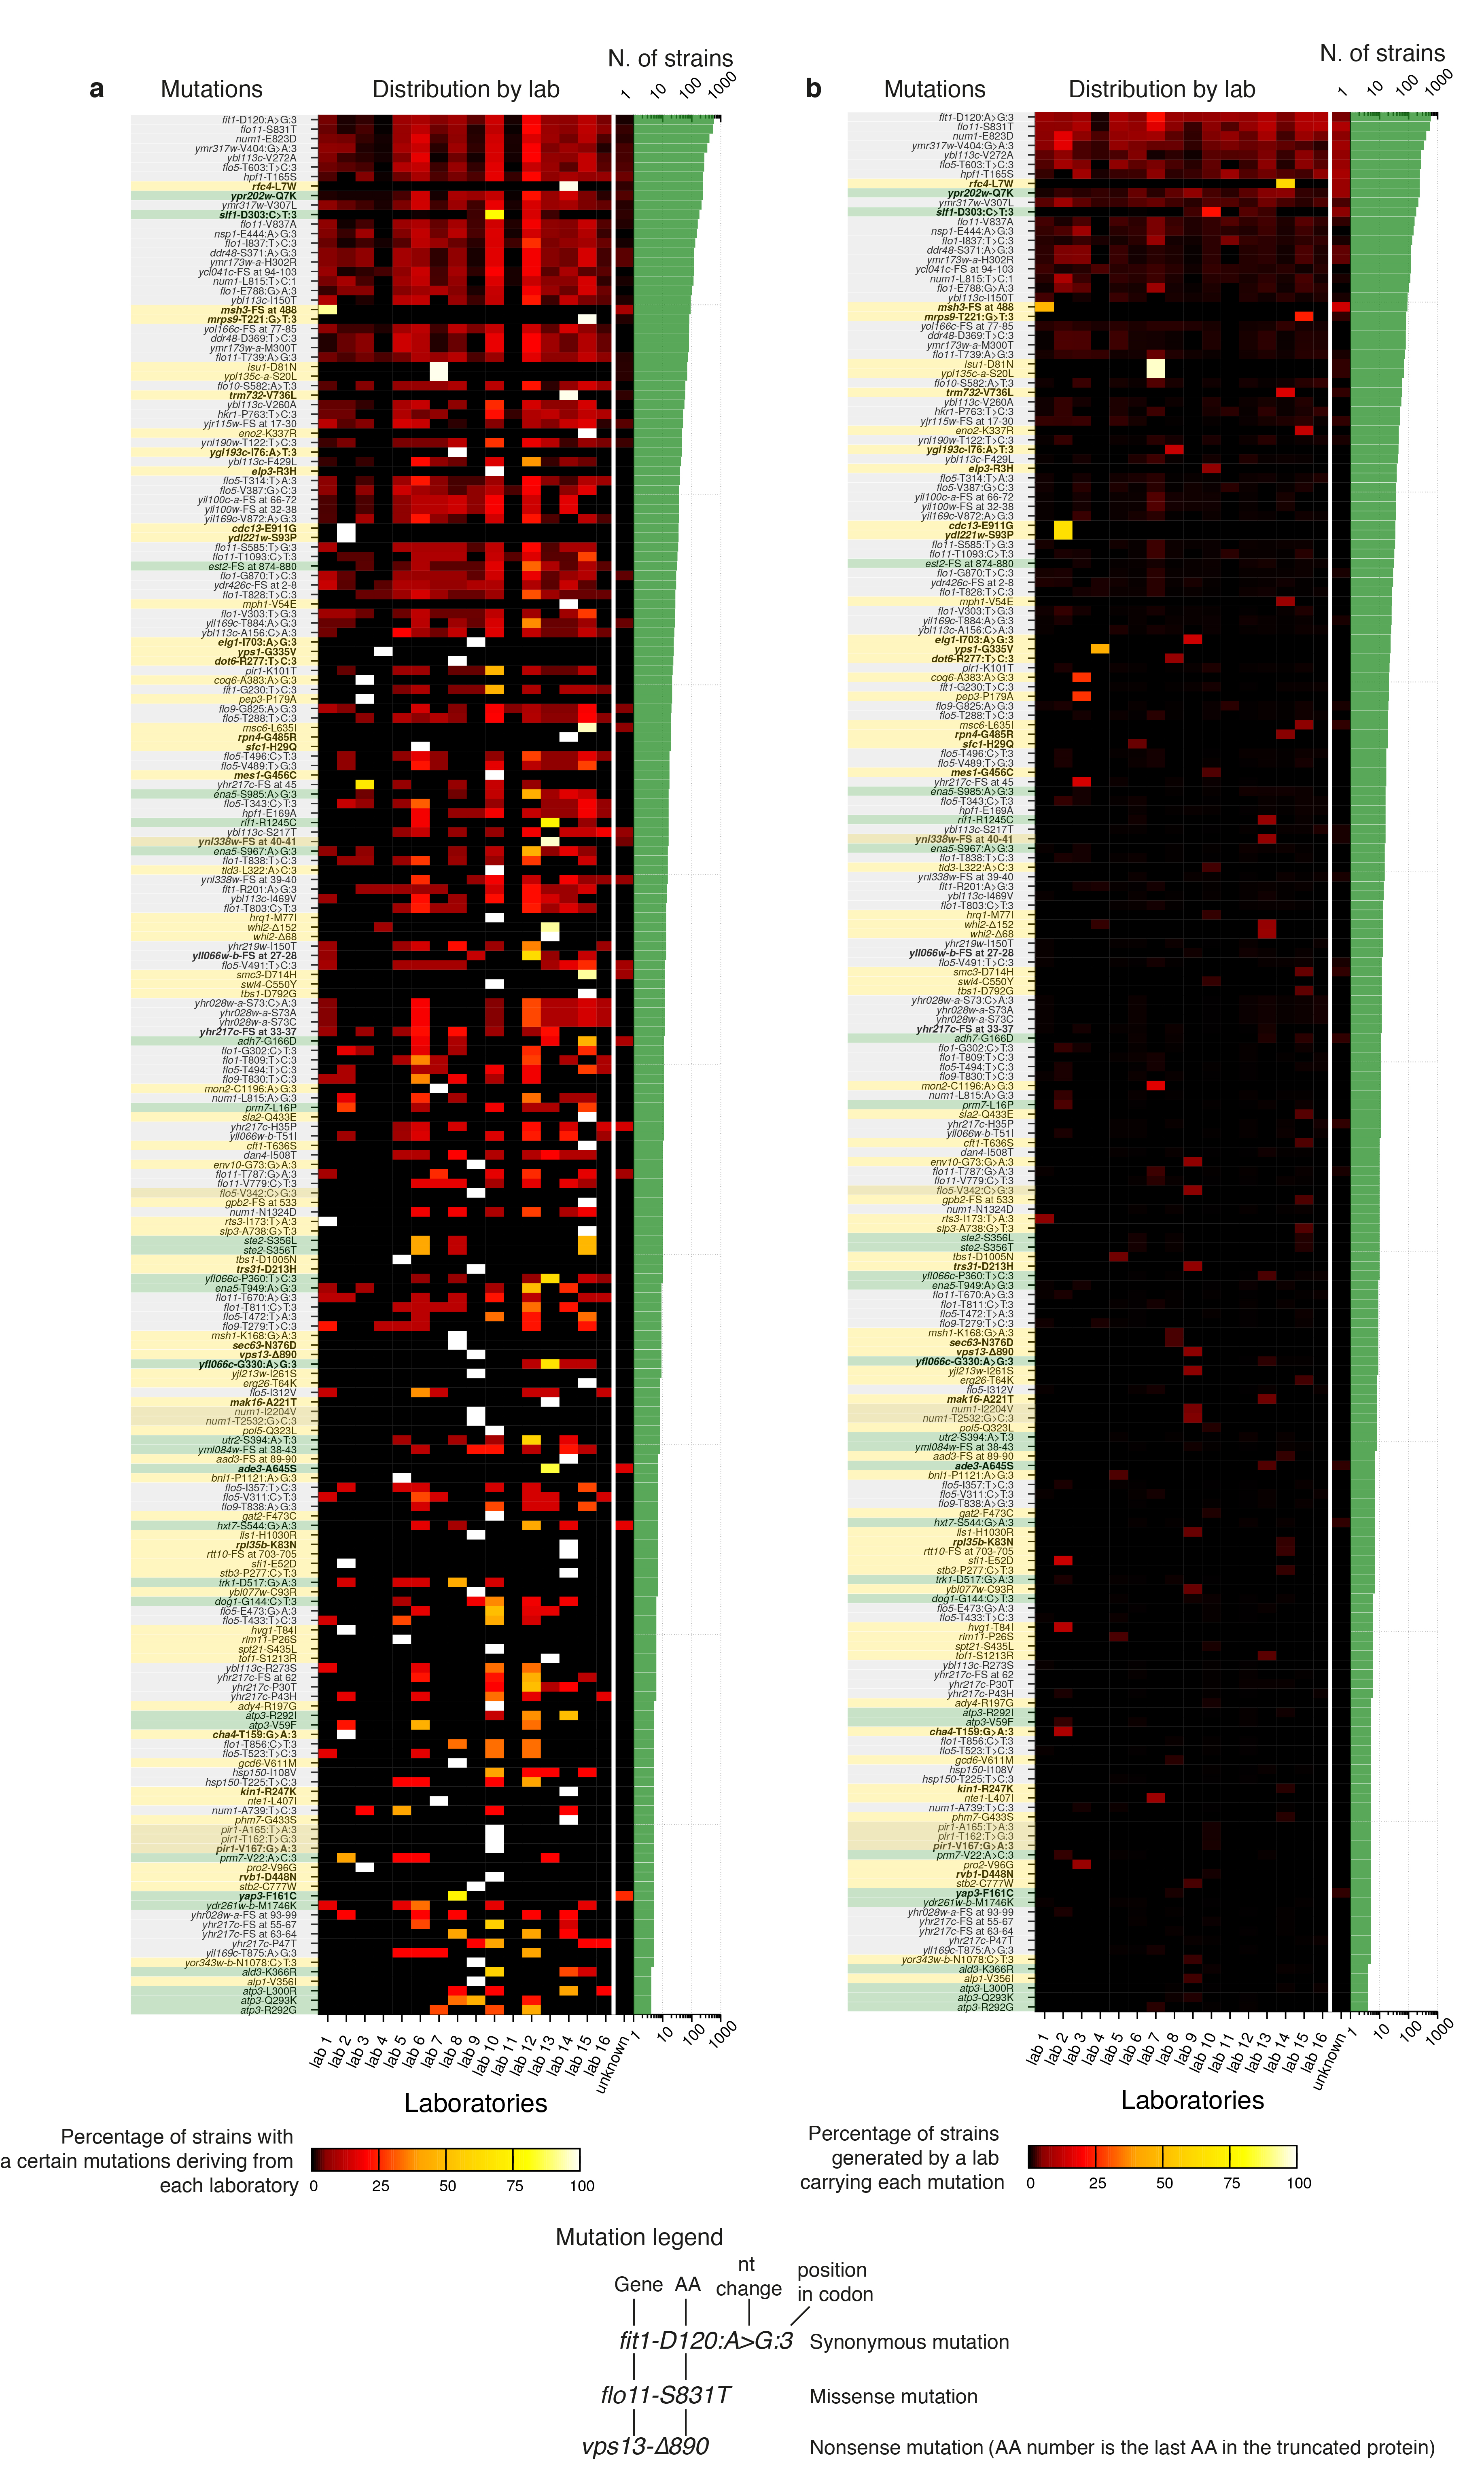
Extended Data Figure 9. Most frequent YKOC mutations and their distributions between different source laboratories.

Most frequent mutations, with predicted effects on genes, detected in the YKOC (top 200) and their distribution among different source laboratories. (a) Left: the mutation is indicated by its predicted effect, and the background indicates whether it is a mutation in a gene with degenerate repeats (grey), a mutation coming from founder effect (yellow), or a frequently mutated site (green); boldface indicates homozygous mutation. Centre: heatmap of the distribution of the most frequent mutations by laboratory in which the strain carrying that mutation was produced (100% indicates that all the strains with a certain mutation were generated in the same laboratory). Right: number of strains carrying the mutation. (b) Not all strains derived from each laboratory share founder mutations: as in (a), but a value of 100% in the heatmap indicates that all the strains generated by a certain laboratory have that mutation.
