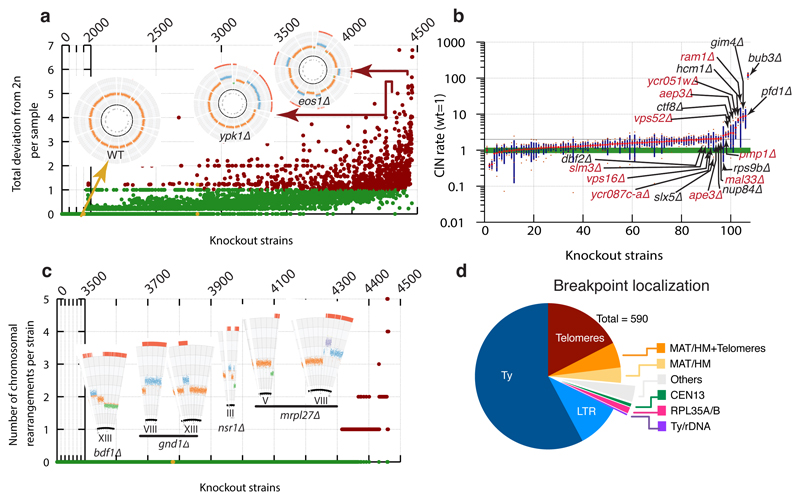
Figure 2. Identification of knockout strains with aberrant karyotypes.
(a) Distribution of total deviation from expected ploidy (2n) for YKOC strains in chromosome units (details in Extended Data Fig 1c legend). (b) CIN estimates for 106 fresh KO strains selected from those with highest deviation from diploidy (n=4 biologically independent samples for most strains; red dot: average; green band: wild-type sample SD; blue column: KO sample SD). (c) Distribution of chromosome rearrangements (CRs) detected in the YKOC (details in Extended Data Fig 1c legend). (d) Localisation of CR breakpoints in strains analysed.

