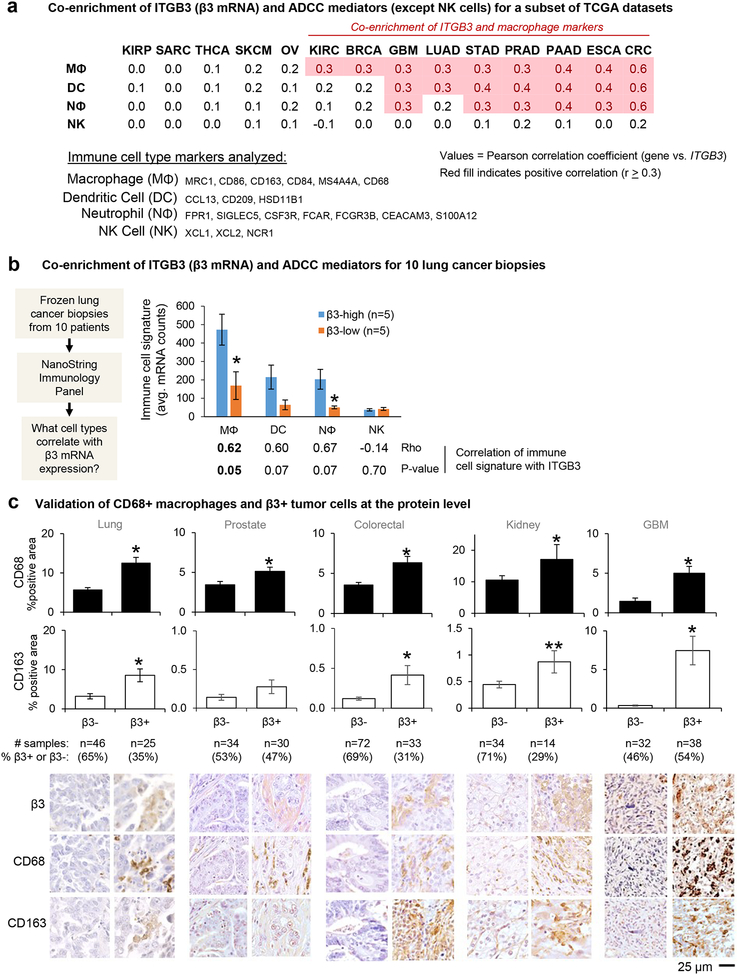
Figure 1: Integrin αvβ3-positive tumors are enriched for ADCC mediators.
(A) The correlation between ITGB3 expression and combined markers of immune cell types was analyzed for the publicly available TCGA data sets listed in the materials and methods. The markers used for each cell type are indicated here and Supplementary Table 1. The table shows the average Pearson’s correlation coefficients for tumors in each dataset using the immune cell type markers listed. Mφ; macrophage, DC; dendritic cell, Nφ; neutrophil, NK; natural killer. RNA Seq V2 RSEM datasets: KIRP = Kidney renal papillary cell carcinoma, TCGA, Provisional, 280 samples. SARC = Sarcoma, TCGA, Provisional, 241 samples. THCA = Thyroid carcinoma, TCGA, Provisional, 397 samples. SKCM = Skin cutaneous melanoma, TCGA, Provisional, 479 samples. OV = Ovarian serous cystadenocarcinoma, TCGA, Provisional, 182 samples. KIRC = Kidney renal clear cell carcinoma, TCGA, Provisional, 534 samples. BRCA = Breast invasive carcinoma, TCGA, Provisional, 1100 samples. GBM = Glioblastoma multiforme, TCGA, Provisional, 166 samples. LUAD = Lung adenocarcinoma, TCGA, Provisional, 517 samples. STAD = Stomach adenocarcinoma, TCGA, Provisional, 415 samples. PRAD = Prostate adenocarcinoma, TCGA, Provisional, 498 samples. PAAD = Pancreatic adenocarcinoma, TCGA, Provisional, 179 samples. ESCA = Esophageal carcinoma, TCGA, Provisional, 83 samples. CRC = Colorectal adenocarcinoma, TCGA, Provisional, 382 samples.
(B) The correlation between ITGB3 expression and combined markers of immune cell types was analyzed for biopsy samples from 10 lung adenocarcinoma patients using nCounter PanCancer Immune Panel (NanoString). Levels of immune cell type markers between β3-high and -low tissues were compared. The table below the graph shows Spearman’s correlation coefficients and P-values. Mφ; macrophage, DC; dendritic cell, Nφ; neutrophil, NK; natural killer.
(C) Tumor microarray slides were stained for β3 integrin and macrophage markers, CD68 and CD163. Graphs show mean±SE for the % positive area for CD68 or CD163, grouped by β3+ vs. β3- status. The number of samples analyzed per array is indicated. *P<0.05 and **P<0.1 using Student’s t test or Mann-Whitney U test compared to β3-negative. The same areas of serial sections stained for integrin β3 and macrophage markers are shown. The same areas of serial sections stained for integrin β3 and macrophage markers are shown. Bar = 25 μm.

