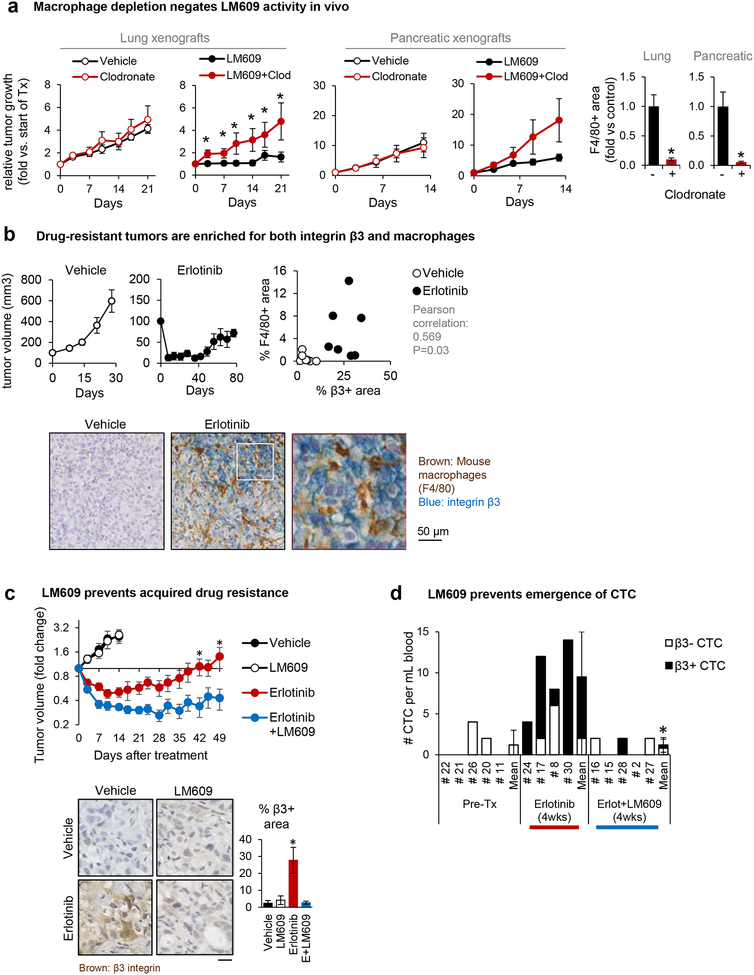
Figure 2: Anti-αvβ3 monoclonal antibody triggers macrophage-mediated tumor cell killing.
(A) Nude mice were subcutaneously injected with β3-positive human tumor cells and treated with combinations of control vs. clodronate liposome (for macrophage depletion) and PBS vs. LM609 (the anti-αvβ3 monoclonal antibody). At the end of the study, the tumor tissues were stained (immunofluorescence or immunohistochemistry) for a mouse macrophage marker F4/80-positive areas to confirm macrophage depletion by the clodronate liposome. Mean±SE is shown for 3–6 mice per group. *P<0.05 compared to control using two-tailed Student’s t test.
(B) Subcutaneous HCC827 tumors from mice treated with erlotinib or vehicle control (Captisol) were harvested and double-stained for the mouse macrophage marker F4/80 (brown) and integrin β3 (blue). The dot plot shows the quantification of % area F4/80+ vs. β3+ area for each tumor.
(C) Mice bearing HCC827 subcutaneous flank tumors were treated with vehicle, the anti-αvβ3 LM609 (10 mg/kg), erlotinib (6.25 mg/kg), or the combination. Tumor dimensions were measured biweekly and volume calculated as V = 1/2 (length × width2). Graph shows mean±SE for n=5 (Vehicle, LM609) or n=9 (Erlotinib, Erlotinib+LM609) mice per group. *P<0.05 for Erlotinib vs. Erlotinib/LM609 using ANOVA. Representative pictures of tumors harvested on day 15 (Vehicle and LM609 groups, n=5) or day 50 (erlotinib and erlotinib/LM609 groups, n=5), stained for integrin β3. The β3-positive area fraction was quantified using ImageJ. Scale bar = 10 μm.. *P<0.05 for Erlotinib vs. Vehicle, LM609, and Erlotinib/LM609 using Student’s t-test. Error bars indicate standard errors.
(D) Mice received orthotopic injections of luciferase- and GFP-expressing HCC827 lung cancer cells. Mice were treated with either erlotinib or erlotinib+LM609 for 4 weeks before euthanasia and circulating tumor cell (CTC) analysis. The numbers of CTC per mL blood are shown. *P<0.05 for Erlotinib+LM609 vs. Erlotinib using Student’s t-test.

