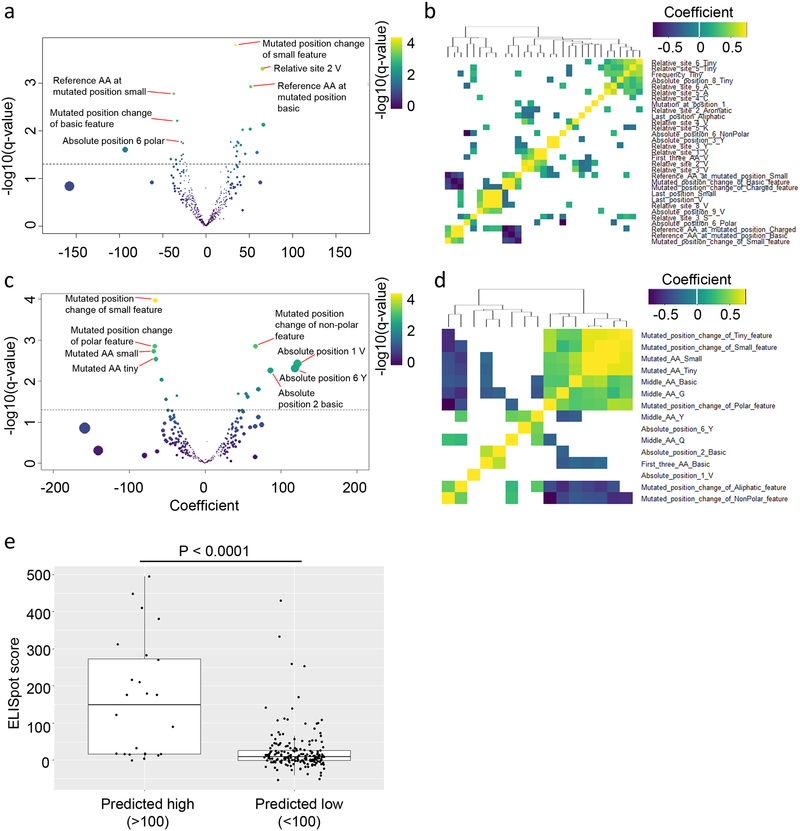
Figure 2: Linear regression analysis between peptide-intrinsic features and tumor antigen immunogenicity.
(A and C) Volcano plots representing the generalized linear method (GLM) coefficient (x-axis) and −log10(q-value)(y-axis) for each peptide-intrinsic feature as a predictor for immunogenicity in (A) class I and (C) class II neoantigens/mHA. Dashed line represents q-value=0.05. Spot color represents −log10(q-value) magnitude and size represents magnitude of the coefficient. (B,D) Heatmap representing Spearman correlations between each significantly correlated feature from (A,C) for (B) class I and (D) class II neoantigens/mHA, respectively. Colored cells represent significantly correlated features (q<0.05), with magnitude of the correlation coefficient represented by color. (E) ELISpot-derived immunogenicity scores for class I neoantigens/mHA classified as predicted high (>100) or low (<100) immunogenic by multivariable GLM regression. Data represent median (middle line), with boxes encompassing the 25th to 75th percentile, whiskers encompassing 1.5× the interquartile range from the box, and independent values shown by dots. Statistics performed with Mann-Whitney U-test, with significance defined as p<0.05.

