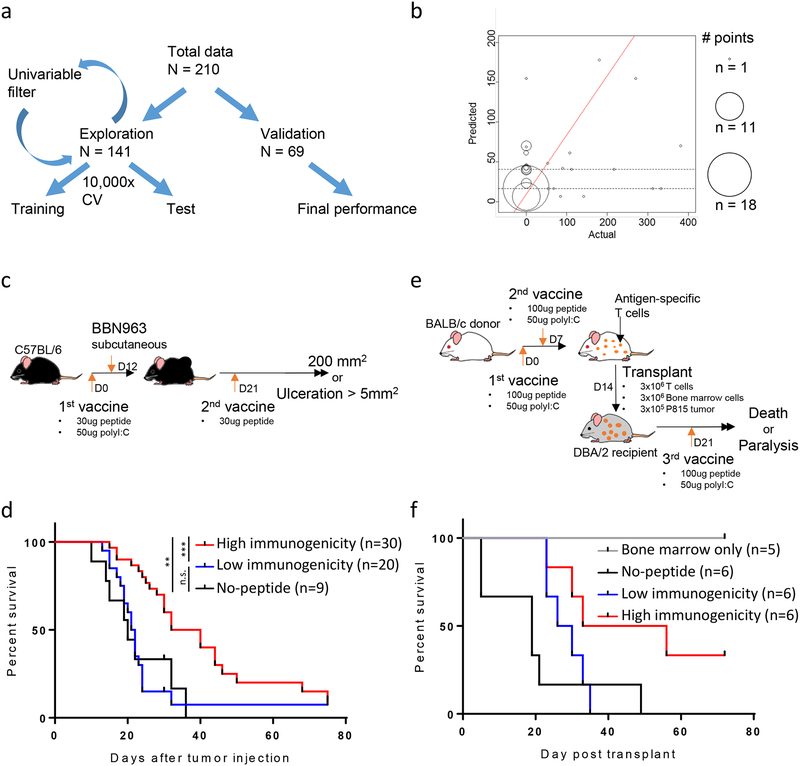
Figure 3: Performance and validation of the gradient boosting model (GBM) approach for predicting neoantigen/mHA immunogenicity.
(A) Schema of the cross-validation approach used for GBM model building. (B) Performance of the final GBM model in validation set, showing actual (x-axis) versus predicted (y-axis) immunogenicity scores. Size of each point represents number of antigens at each coordinate. Red line represents the line of best fit, with p-value of fit shown above the graph. (C,E) Schema for in vivo validation experiments, with tumor vaccine studies performed in (C) BBN963 basal-like bladder cancer and (E) the P815 mastocytoma syngeneic transplant model. (D,F) Kaplan-Meier survival curves for animals bearing (D) BBN963 basal-like bladder cancer and (F) P815 mastocytoma syngeneic transplants. Animals treated with predicted high (red) or low (blue) immunogenicity antigens, no-peptide control (black), or bone marrow only control (grey). Data in (D) represents two independent experiments. Data in (F) represents one independent experiment. Statistics performed with log-ranked testing (**p<0.01; ***p<0.001).

