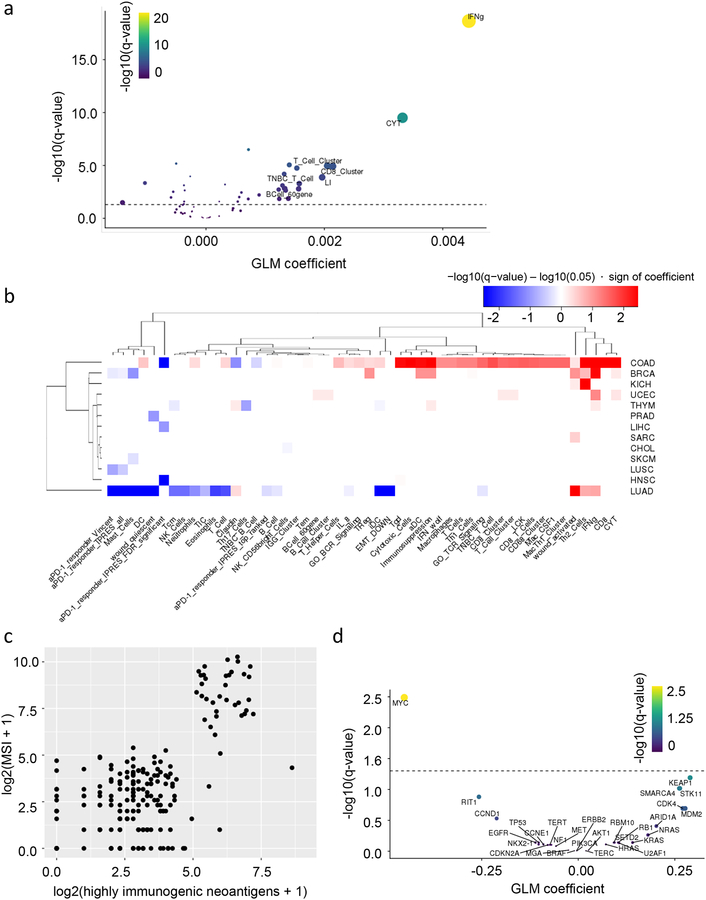
Figure 4: Correlative analysis of predicted neoantigen immunogenicity in TCGA human datasets.
(A) Volcano plot representing generalized linear method generalized linear method (GLM) coefficient (x-axis) and −log10(q-value)(y-axis) between numbers of highly immunogenic neoantigens (HINs) and immune gene signatures (IGSs) in TCGA pan-cancer datasets. (B) Heatmap representing GLM regression between numbers of HINs and IGS for each TCGA cancer subset. Color represents direction of coefficient (red: positive; blue: negative), and shade represents −log10(q-value) magnitude. (C) Number of HINs (x-axis) versus microsatellite instability (MSI) score (y-axis) for a TCGA colorectal carcinoma (COAD) dataset. (D) Volcano plot representing GLM coefficient (x-axis) and −log10(q-value)(y-axis) between average expression of IGS in (B) with significantly negative association with HIN burden and oncogene/tumor suppressor copy numbers in a TCGA lung adenocarcinoma (LUAD) dataset. (A,D) Dashed line represents q-value=0.05.

