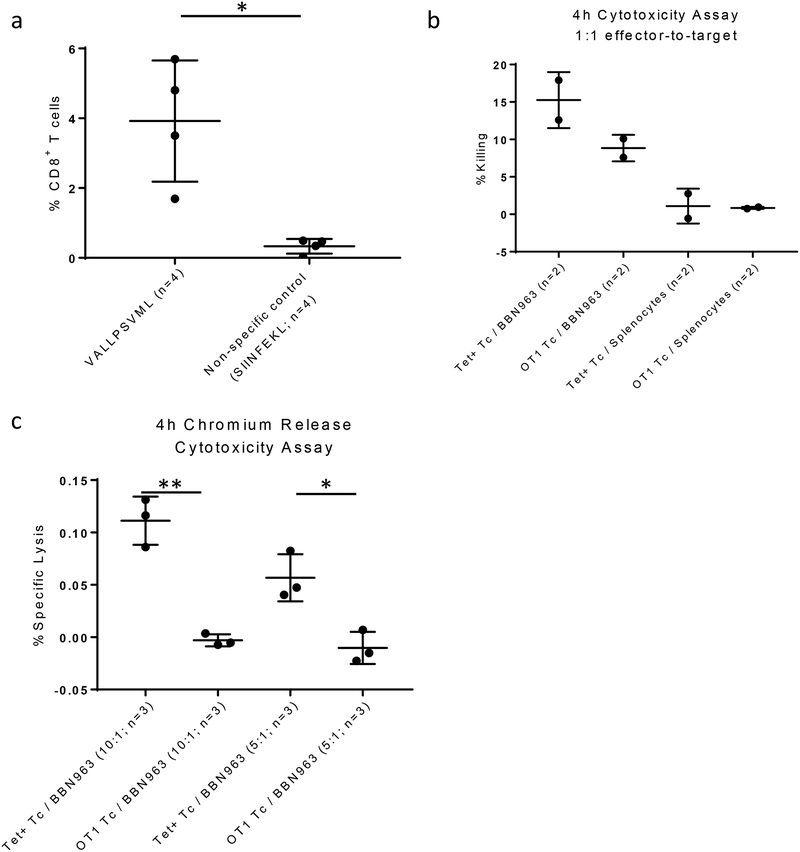
Figure 5: Analysis of out-of-frame epitope B2-specific T cells.
(A) Percent B2 tetramer–positive (left) versus irrelevant SIINFEKL-tetramer control (right) BBN963 tumor-infiltrating CD8+ T cells. Statistics performed with Mann-Whitney u-test (*p<0.05). (B) 4-hour flow cytometric cytotoxicity assay, comparing percent specific killing in 1:1 cocultures of B2 tetramer–specific T cells or OTI irrelevant T-cell controls versus BBN963 target or irrelevant splenocyte target control. Percent killing represents spontaneous target death background subtracted values. Statistics not performed for (B) due to n=2 sample size across all groups. (C) 4-hour chromium-51 release assay, comparing percent specific killing in cocultures of B2 tetramer–specific T cells or OTI irrelevant T-cell controls versus BBN963 targets at 10:1 and 5:1 effector-to-target ratios. (A-C) Error bars represent mean±standard deviation. Data from each graph represents one independent experiment, respectively. Statistics performed with Welch’s t-test (**p<0.01; *p<0.05).

