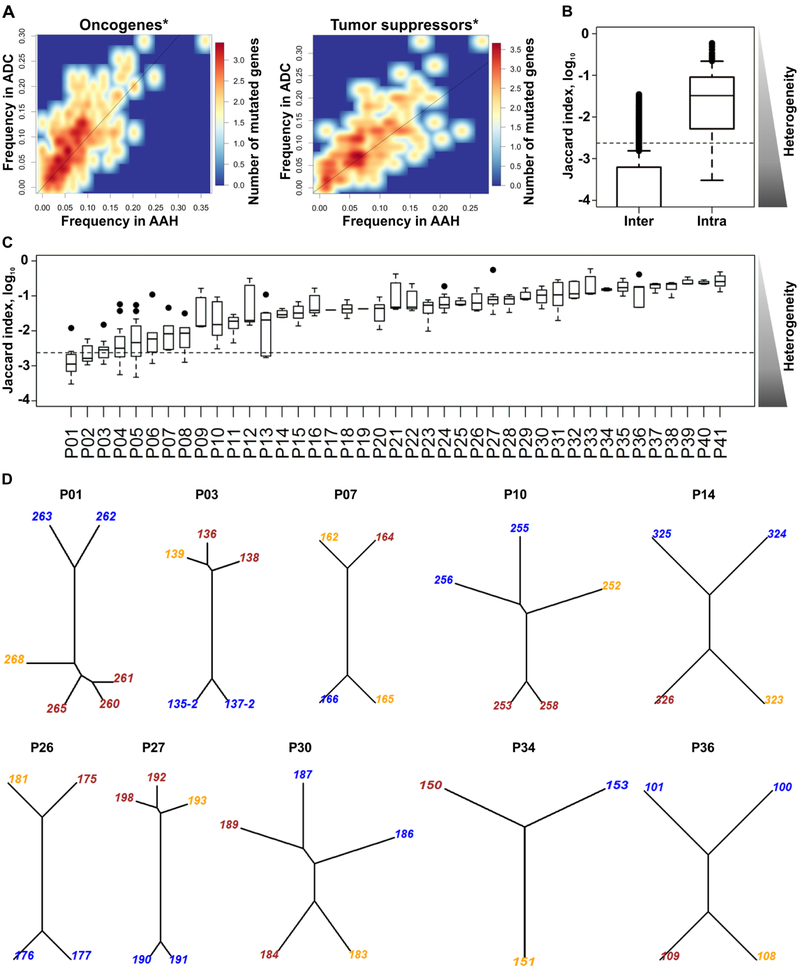
Figure 1. Genetic heterogeneity of pulmonary lesions.
A) A density heat map of mutated oncogene and tumor suppressor gene frequencies in ADC (y-axis) or AAH (x-axis). Oncogenes (upper panel) and tumor suppressor genes (lower panel) are mutated at higher frequencies in ADC than in AAH (above diagonal line; Wilcoxon test *p < 7.2 × 10⁻⁹ and **p < 1.7 × 10⁻⁸). B) Distribution of Jaccard indices comparing n.s. somatic mutation heterogeneity between pairs of lesions from the same (intra-) or different (inter-) patients. C) Distribution of intra-patient Jaccard indices in 41 individual patients. The subjects are displayed in the low-to-high order based on their median values. Black circles indicate lesion pairs with >95 percentile Jaccard indices. In B and C, the side triangles represent the heterogeneity levels inversely proportional to Jaccard indices, and the dashed line marks the 90 percentile level of inter-subject Jaccard index. D) Phylogenetic trees for 10 patients with AAH (blue), AIS (orange) and ADC (brown). The numbers are lesion IDs. Phylogenetic trees for the entire cohort are shown in Supplementary Figure S1.

