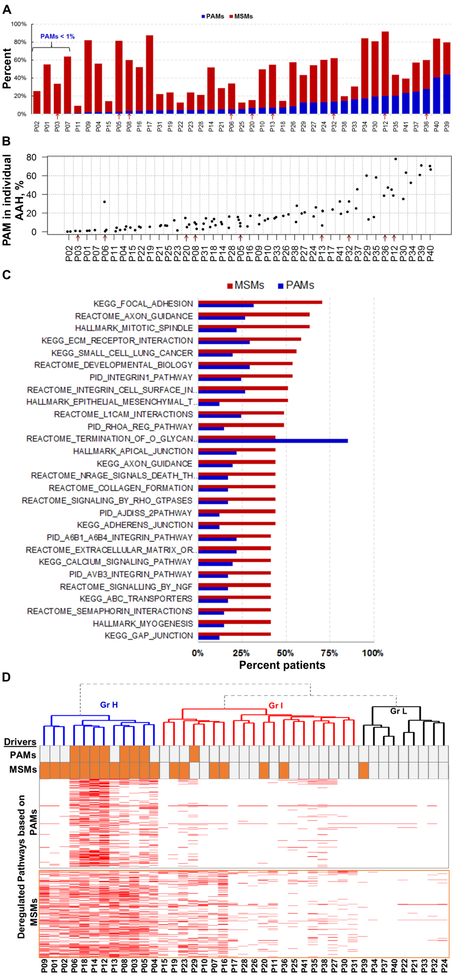
Figure 2. Progression-associated mutation (PAM) and malignant-specific mutation (MSM) distribution and the role in pathway deregulation.
A) Distribution of PAMs and MSMs in 41 study patients. The patients are displayed in the low-to-high order based on their percentages of PAMs. Red arrows in A and in B indicate nine patients whose cellular immune response was evaluated. B) Percentage of PAMs in individual AAH lesions from 41 patients. The cases are displayed in the low-to-high order based on their median levels, and not in the same order as those in A. C) The top 27 pathways frequently affected by MSM- (red) and PAM- (blue) bearing genes. D) Heatmap of the pathways affected (red) by PAM- (top) and MSM- (bottom) bearing genes. The mutations in the 29 driver genes observed in PAM and MSM are indicated by orange bars above the heatmap.

