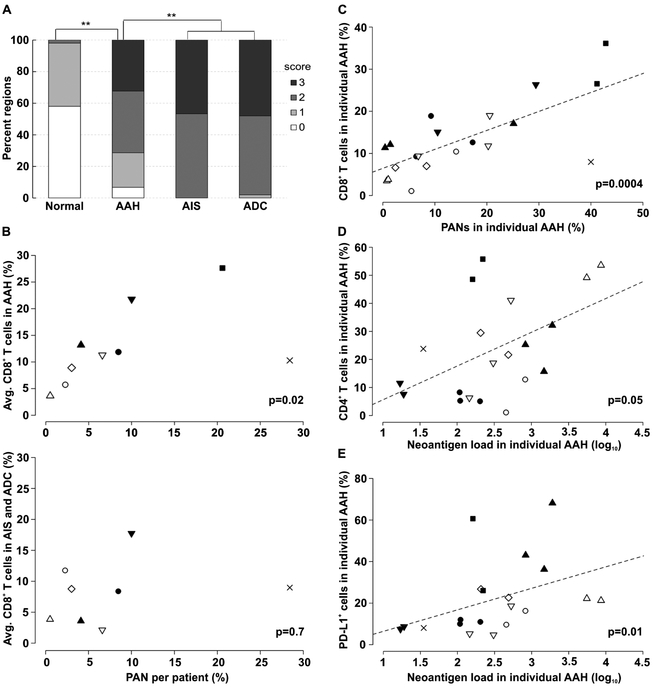
Figure 3. Immune cell infiltration, neoantigens and the immune response in adenomatous premalignancy.
A) Local lymphocyte infiltration index (0 — lowest, 3 — highest) in adjacent normal tissue, AAH, AIS and ADC (**X2 test p < 10−10). B) Average percentages of infiltrating CD8+ T cells observed in AAH (upper panel) and ADC (lower panel) plotted against percentage of patient-wise PANs. Each patient is represented by a data point indicated by a unique symbol. ADC in one patient was not evaluated. C) Correlation between the percentage of infiltrating CD8+ T cells and the percentage of PANs in corresponding AAH lesions. D-E) Correlation between the percentage of infiltrating CD4+ T cells (D) and PD-L1+ cells (E) plotted against the corresponding log-transformed neoantigen number identified in AAHs. In C-E each region is represented by a point, while each patient is marked by the symbol identical to those in B. P-values are based on Kendall rank correlation coefficient. The trend line (dashed line) in C-E indicates the linear association between variables. Other pair-wise comparisons between immune marker levels and neoantigen-related variables were insignificant.

