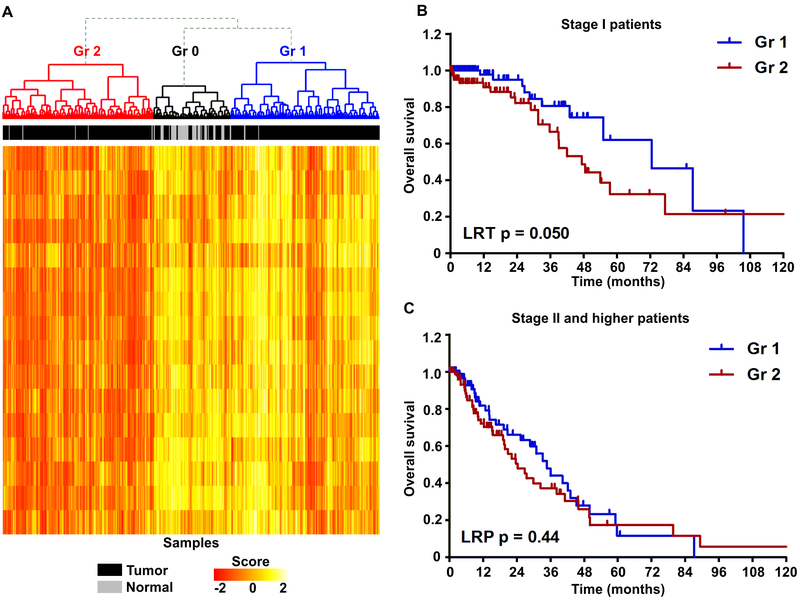
Figure 4. Analysis of immune pathway deregulation and patient outcomes in TCGA LUAD.
A) Heatmap of gene expression scores of 16 immune-related pathways in TCGA LUAD and normal lung samples. B-C) Kaplan-Meier survival curves of stage I (B) and stage II and higher (C) patients from the groups identified in (A).

