
Figure 4: Genomic context of differentially methylated probes shows enrichment for open sea regions of the genome and CpG Island shores near transcription start sites.
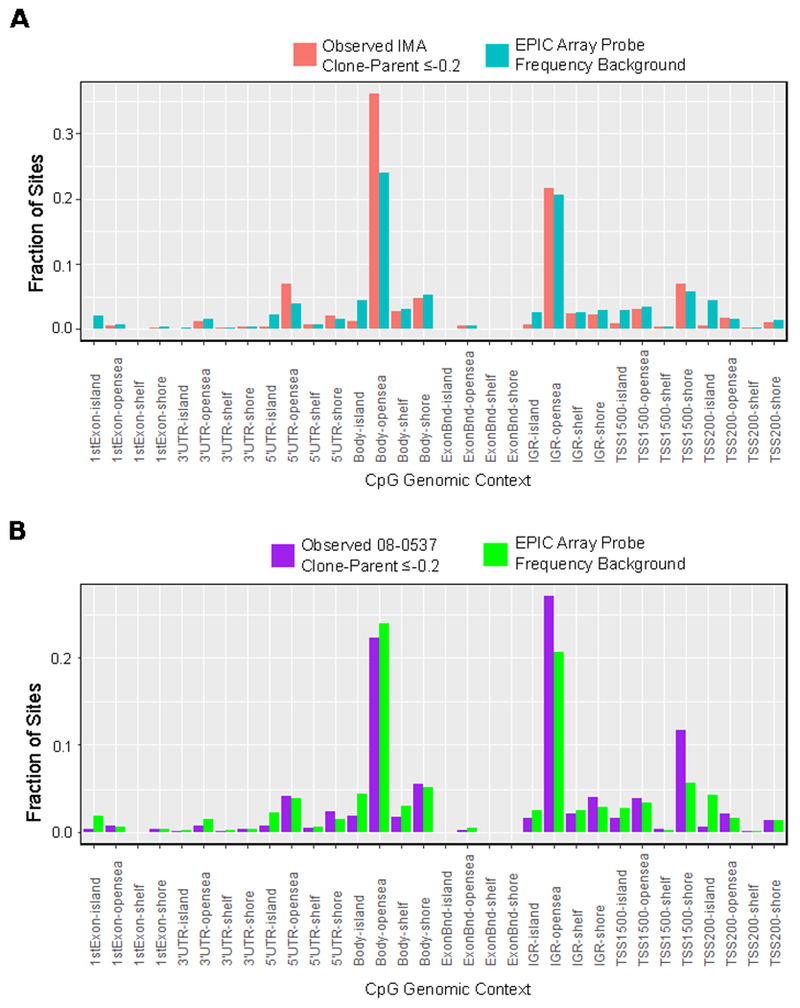
A, Fraction of CpG sites identified as differentially methylated with change in Beta value ≤−0.2 concurrent in all three IDH1−/WT clones of IMA and no corresponding change in Beta value ≤−0.2 in either unedited clone. Plotted in blue is the frequency of CpG sites within each genomic context on the EPIC array. Chi-squared goodness of fit p-value for difference from expected background frequency < 2.2x10^−16 B, Similar enrichment plot for 08-0537 using change in Beta value ≤−0.2 in the clone with loss of heterozygous IDH1R132H/WT status and removing probes showing a delta Beta value ≤−0.2 change in matched unedited control clone. Chi-squared goodness of fit p-value for difference from expected background frequency < 2.2x10^−16.