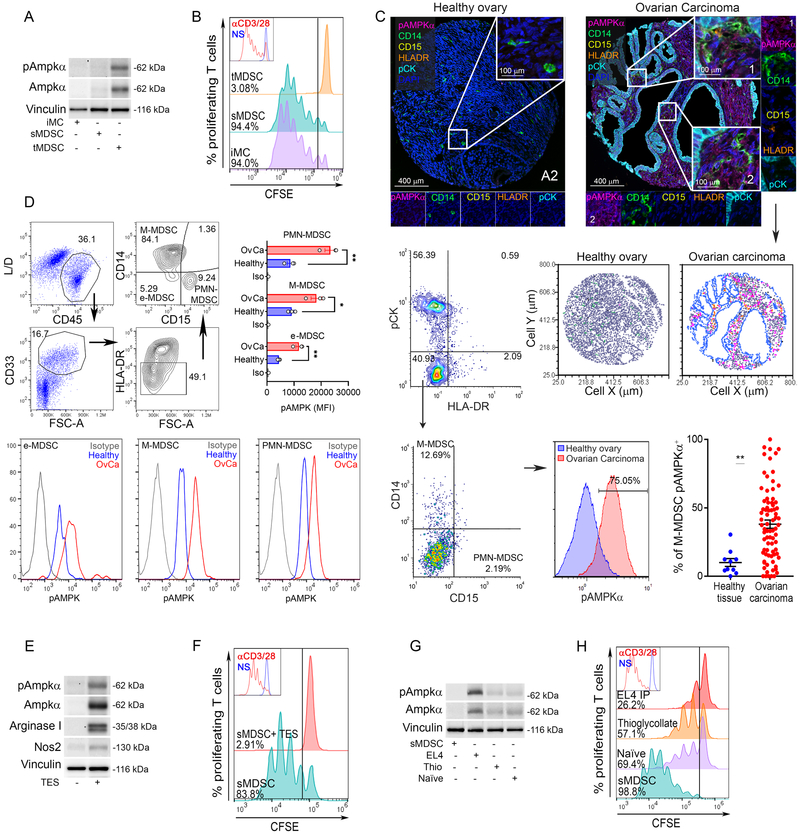
Figure 1. TME induces AMPKα in MDSC and boosts their immunoregulatory activity.
(A). Total and phospho-Ampkα in tumor-MDSC (tMDSC) and splenic-MDSC (sMDSC) from mice bearing LLC tumors, and in CD11b+ Gr1+ cells (iMC) from non-tumor bearing mice. Illustrative Immunoblot result from 5 mice.
(B) Representative result from 5 repeats showing the regulatory effect of tMDSC, sMDSC, and iMC on the proliferation of CFSE-labeled T-cells primed with plate-bound anti-CD3/CD28. T-cell proliferation was assessed 72 hours post-activation by flow cytometry. N=5.
(C). Top: Representative images (20x resolution and further 10x digital magnification) showing phospho-AMPKα (Magenta), CD14 (Green), CD15 (Yellow), HLA-DR (Orange), pan-Cytokeratin (pCK, Cyan), and DAPI (Blue) in a TMA containing healthy ovarian tissues (N=10, left) and ovarian carcinoma tumors (N=79, right) by Vectra Automated Multispectral Imaging. Middle right: Representative cellular phenotype map showing the location of cells resembling M-MDSC (pCKneg HLA-DRneg CD14+ CD15neg, green dots), phospho-AMPKα+ M-MDSC (pink dots), monocytes-Dcs (pCKneg HLA-DR+ CD14+ CD15neg) (orange dots), pCK+ tumor cells (blue dots), and undefined stromal cells pCKneg (grey dots). pCKneg HLA-DRneg cells from ovarian tumors or healthy tissues (Middle left) were gated and plotted for CD14 (M-MDSC) or CD15 (PMN-MDSC) (Bottom left), and M-MDSC compared for phospho-AMPKα expression (Bottom center) and frequencies of phospho-AMPKα+ M-MDSC (Bottom right). Mean ± s.e.m.**p < 0.01 by unpaired Student’s t-test.
(D) Top-left: Representative gating strategy for identification of e-MDSC, M-MDSC, and PMN-MDSC from peripheral blood of ovarian cancer patients and healthy controls. Merged (Top-right) and representative (bottom) phospho-AMPKα levels in MDSC subsets (N= 3/group).
(E). Total and phospho-Ampkα, Arginase I, and Nos2 in splenic-MDSC treated for 72 hours with 20% TES from primary LLC tumors. Representative immunoblot from 3 repeats.
(F). Anti-proliferative effect of MDSC from (E) on CFSE-labeled T-cells primed as in (B). N=3.
(G-H). CD45.1+ sMDSC were transferred into: naïve CD45.2+ mice, CD45.2+ mice bearing i.p. CD45.2+ EL4 tumors, or CD45.2+ mice previously injected with thioglycolate. CD45.1+ sMDSC were sorted 18 hours later. Representative results of total and phospho-Ampkα expression (G) and immunosuppressive activity on T-cells (H). N=4

