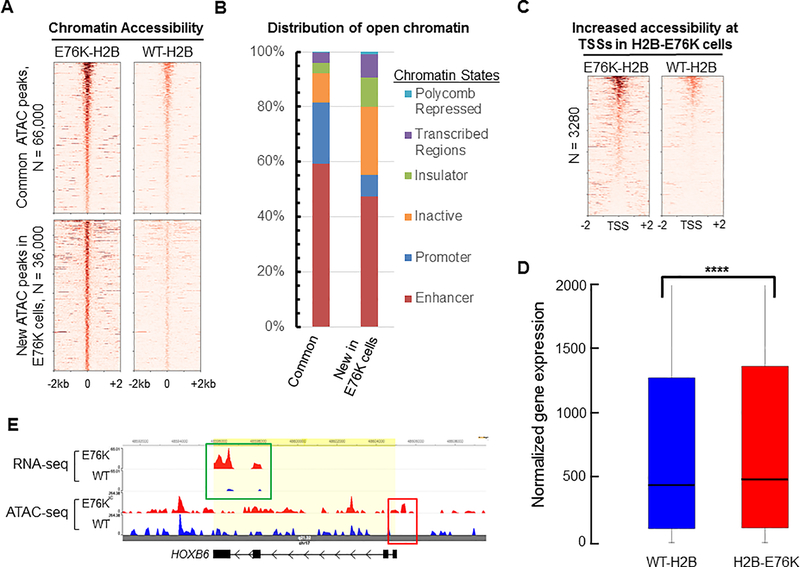
Figure 7. Expression of H2B E76K alters chromatin accessibility in MCF10A cells.
(A) Heat maps of ATAC-Seq peaks from MCF10A cells expressing either WT H2B or H2B-E76K found within a ± 2kb window, ordered by highest ATAC-Seq signal to lowest. Peaks found in both cell lines are listed as common peaks. Peaks significantly enriched in cells expressing H2B-E76K are denoted as new peaks in E76K. (B) The distribution of ATAC-Seq peaks among six broad classes of chromatin states was performed using the encode HMEC ChromHMM data set. (C) Heat maps of ATAC-Seq reads within +/− 2 kb of transcription start sites (TSS) for genes with significantly increased chromatin accessibility at promoter regions of MCF10A cells expressing H2B-E76K compared to cells expressing WT-H2B. (D) Box and whiskers plot for gene expression of the 3280 genes that have increased ATAC-Seq signal at the TSS in cells expressing H2B-E76K compared to expression of those genes in cells expressing WT-H2B. *** indicates that P < 0.001. (E) Genome browser tracks of a representative gene (HOXB6) with increased chromatin accessibility at the TSS in cells expressing H2B-E76K (red box) that corresponds with increased expression (green box).

