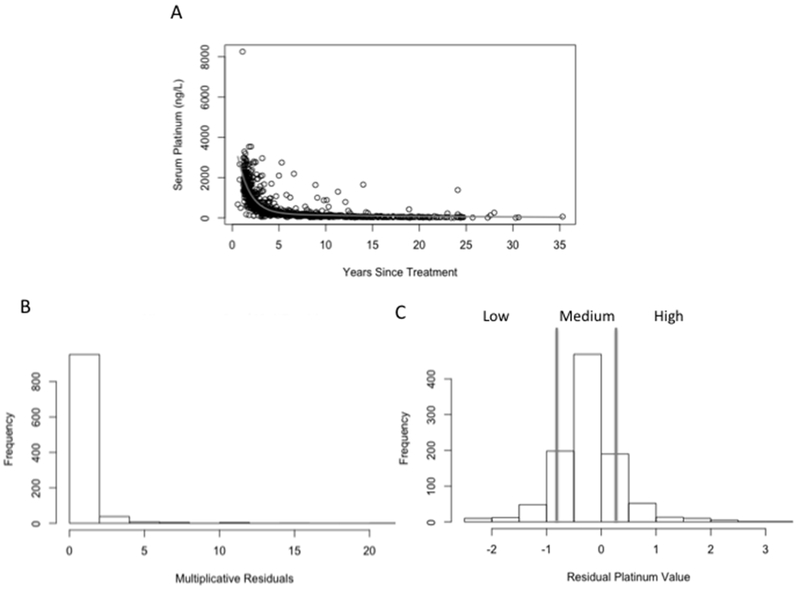
Figure 1. Population Pharmacokinetic Modeling of Long-Term Serum Platinum Levels.

A) Serum platinum levels from 1,010 TCS were fitted to a bi-exponential model in which years since treatment completion was taken into account. Cumulative cisplatin dose was taken into account by multiplying the serum platinum levels of 400 ± 15 mg/m2 patients by 0.75, enabling normalization to 300 ± 15 mg/m2 patients prior to model fitting. B) Histogram of multiplicative residuals from the bi-exponential model. C) Residuals were log-transformed to fit a near normal distribution in order to examine the extent to which residual platinum values associate with cisplatin-induced toxicities. The bars denote groups of low, medium and high.
