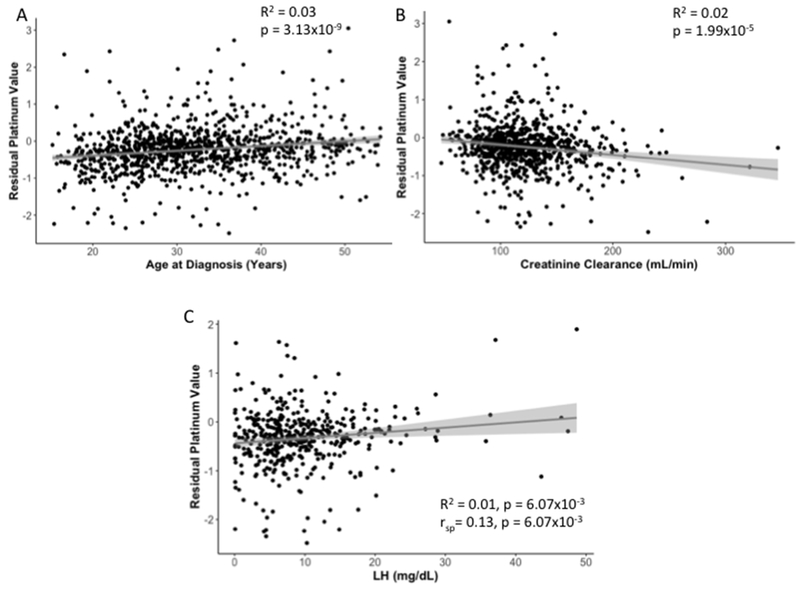
Figure 2. Linear Regression of Residual Platinum Value and Continuous Variables.

Simple linear regression results are presented for A) age at diagnosis, B) creatinine clearance, and C) LH levels. R2 and p-values for linear regression are reported for all phenotypes. A Spearman rank correlation test (rsp) was also performed on LH levels due to its positive skew distribution, and results are shown in panel C. Fitted linear regression lines are highlighted in gray and 95% confidence intervals are indicated by the light gray shaded regions.
