
Figure 3. Distributions of Cisplatin-Induced Toxicities in Testicular Cancer Survivors Based on Residual Platinum Value.
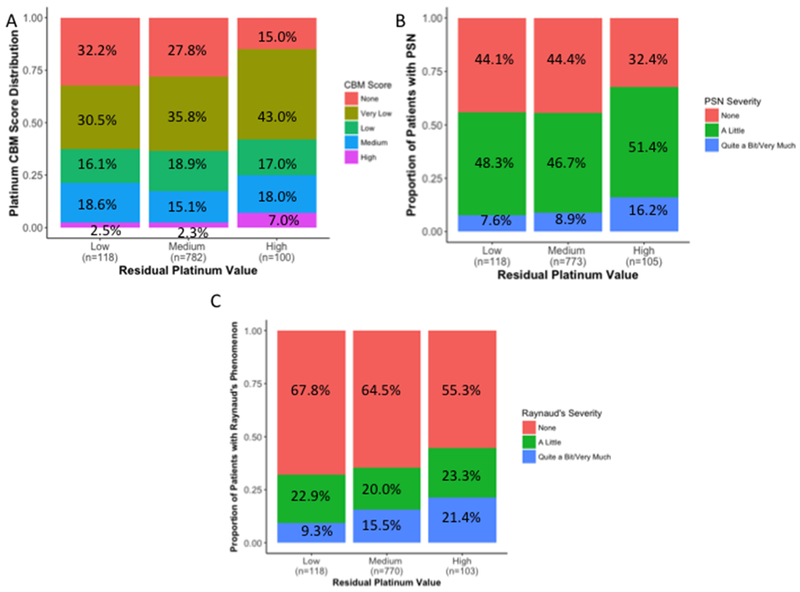
The overall distribution of A) CBM score for cisplatin-induced toxicities (p = 0.06), B) peripheral sensory neuropathy (PSN; p = 0.02), and C) Raynaud’s phenomenon (p = 0.02) in TCS based on having low, medium, and high residual platinum values is provided. Low, medium, and high groups reflect ordinal stratifications of residual platinum values based on their deviation from the mean: “medium” (regression residuals = 0 ± 1 standard deviation [SD]), “low” (residuals < −1 SD), and “high” (residuals > 1 SD). All three toxicities are divided into different degrees of severity, as indicated in the legend, with associated percentages provided in each panel. Sample sizes for each group are indicated within each panel on the x-axis. Differences between the proportions of toxicity severity observed for the low, medium, and high residual platinum value groups were evaluated for statistical significance through the Cochran-Armitage-Mantel 1df chi-square trend test (54).