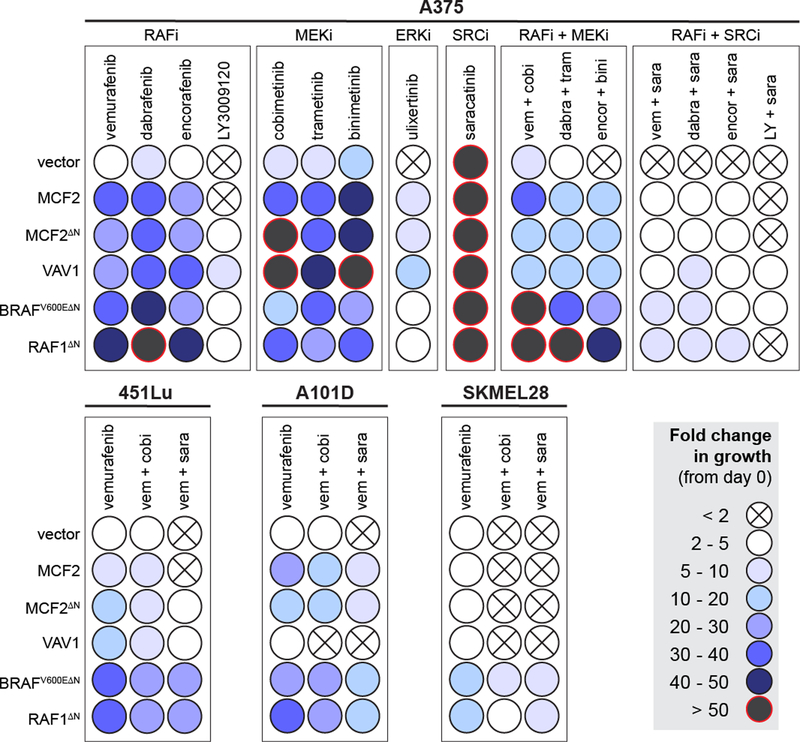
Figure 6. Performance of candidate resistance drivers across a panel of MAPK inhibitors.
The ability of candidates to increase resistance to the indicated drugs is shown as a relative colorimetric endpoint (see legend). Each candidate was tested in the indicated drug combination in A375, 451Lu, A101D, and SKMEL28. Rows represent independent populations engineered to express the indicated candidate drug resistance driver shown at the left.

