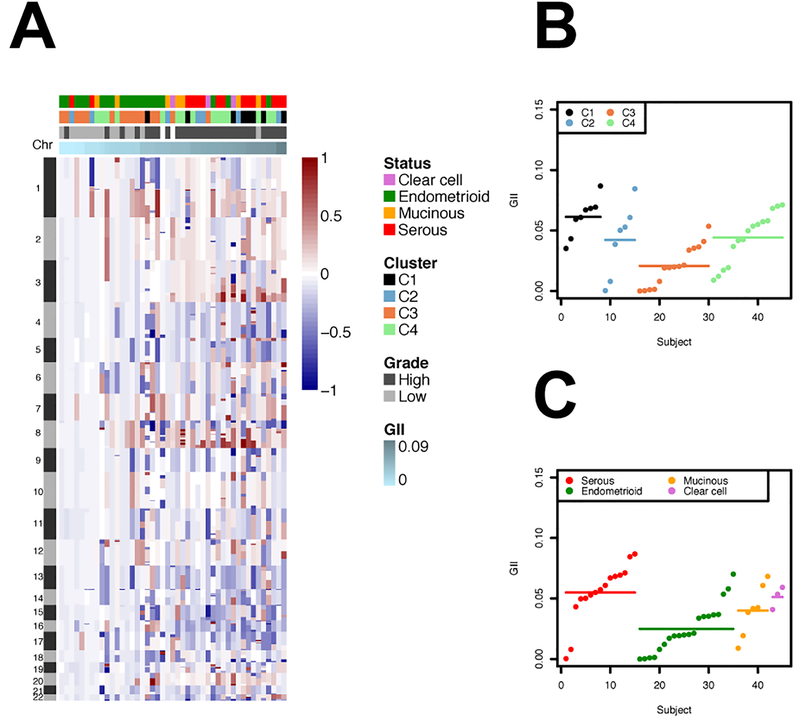
Legend Figure 2.
A. Genomic profile of the segmented data, ordered by GII. B. GII distribution by clusters indicated by dots: C1 (N=8), C2 (N=7), C3 (N=15) and C4 (N=15); segments indicate the mean values. Wilcoxon rank-test P-value (C1 vs. C3)=7.75×10⁻⁵. Wilcoxon rank-test P-value (C3 vs. C4)=0.0037. Other comparisons were not statistically significant. C. GII distribution by histologies indicated by dots: clear cell (N=3), endometrioid (N=20), mucinous (N=7) and serous (N=15); segments indicate the mean values. Wilcoxon rank-test P-value (serous vs. endometrioid)=8.2×10⁻⁴. Wilcoxon rank-test P-value (endometrioid vs. clear cell)=0.035. Other comparisons were not statistically significant.

