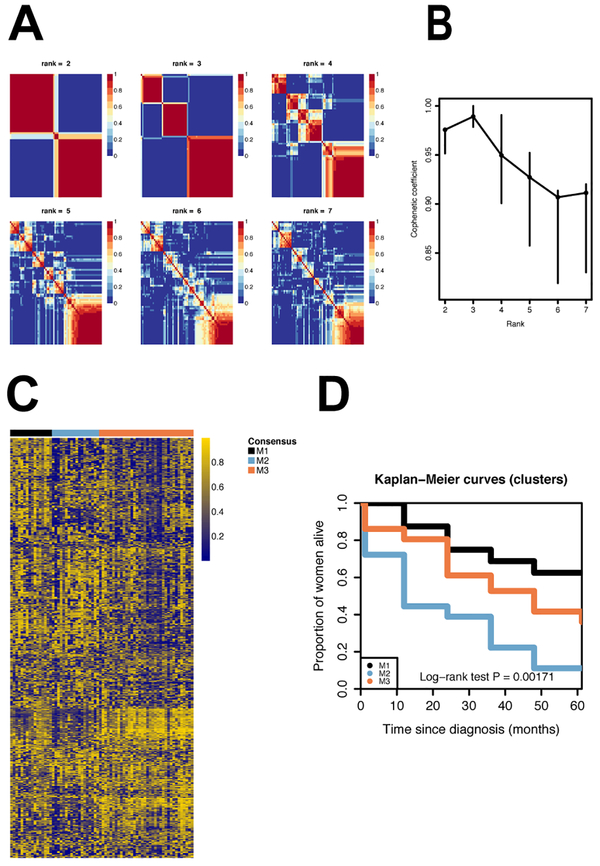
Legend Figure 3.
Unsupervised non-negative matrix factorization based on the 1,000 most variable probes based on the median absolute deviation (MAD). A. Consensus matrices for k=2 to k=7. B. Cophenetic correlation coefficient for k=2 to k=7. C. Methylation profiles of the clusters. D. Survival curves for the methylation derived clusters: M1 (N=16), M2 (N=18) and M3 (N=36).

